Building for Efficiency: Show Me the Money

The following is part two of our four-part series Building for Efficiency, examining a groundbreaking new report on cost and emissions in new construction. If you’re just joining us, part one can be found here.
Any informed decision on policy is guided by effective modeling. So, what exactly did we model in our new report, Building for Efficiency, and what does it tell us about consumer preferences?
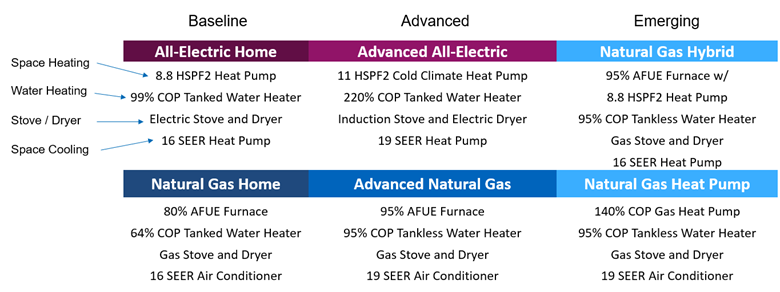
We used a 2,400 square foot home model created by the U.S. Department of Energy to represent the average new home in the Midwest (this is the same theoretical home that the Rocky Mountain Institute uses for their own modeling on electrification). That home is then modeled with a variety of types of appliances, energy types and efficiencies. See the table below, which explains each of the six types of home we modeled. (Worth noting – we only modeled electric homes with heat pumps, even though 19% of all new electric homes – 102,000 homes – used a vastly more inefficient electric resistance furnace.)
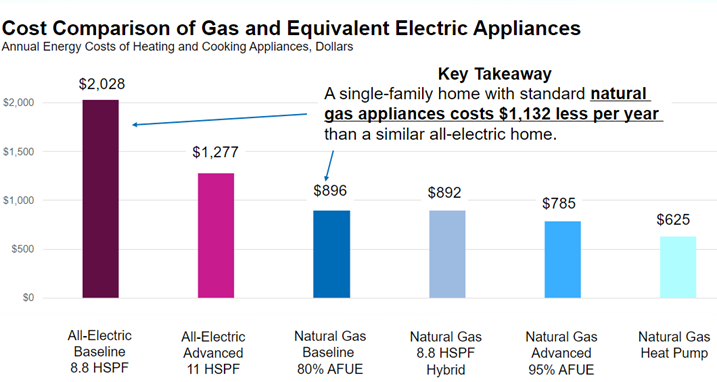
Most prospective homebuyers considering what type of home to build from the options above care how much it will cost upfront, how high their monthly energy bills will be, and, increasingly, how to lower their home’s greenhouse gas emissions. We’ll start with a national comparison of annual operating costs. Take a look at the graph below.
As you can see, the cheaper, lower efficiency electric heat pump home has the highest annual energy costs for the modeled appliances, at a little over $2000 a year in annual energy bills, followed by the cold climate heat pump home at around $1300 per year. All four of the most cost-effective homes use natural gas, with costs between half and a quarter as high as the higher efficiency electric home.
Among the six options modeled, two are by far the most common. Of the people who choose natural gas, 75% will opt for a high efficiency (92% or greater efficiency) natural gas furnace. In cold climates, that number rises to 90% of homes. For people that opt for all-electric homes, 92% will be a close match for the least efficient all-electric home modeled. One major reason people make these choices? Installation costs.
What do you notice about the installation costs in the chart below? The more efficient natural gas furnace costs only a little more upfront than the least efficient natural gas furnaces. By comparison, the least efficient electric home modeled is a fraction of the cost of the higher efficiency electric home.
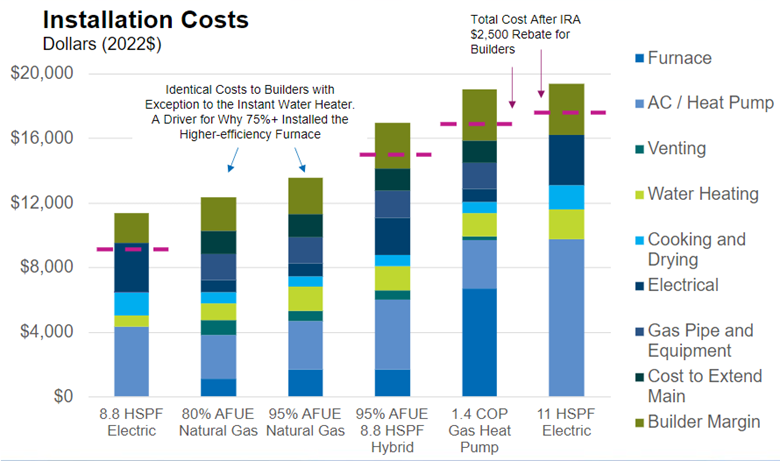
Operating costs are spread out over decades and dependent on local conditions and home weatherization. Upfront costs for builders and the home buyer are much more easily apparent. The least efficient all-electric home has the lowest upfront cost, while the most efficient all-electric home is the most expensive. This difference doubtless helps explain why 92% of people who heat with electricity opt for less efficient appliances. Interestingly, high efficiency and low efficiency natural gas furnaces have an almost identical cost to install – and since it doesn’t impact your upfront costs, people mostly just choose the more efficient option.
Key Takeaways:
- Most people who choose natural gas choose highly efficient natural gas furnaces.
- Most people who choose to go with an all-electric heat pump use the least efficient, highest ongoing cost and emissions models.
- In a typical American climate, a natural gas home is almost certainly more affordable to heat than even the most efficient all-electric homes.
- Upfront cost has a significant impact on which appliances homebuyers and builders choose.
- If you’re willing to spend heat pump money in a cold climate, you should strongly consider a lower-cost, lower emissions natural gas heat pump.
Join us next week for part three of Building for Efficiency to learn more about the value proposition for natural gas as a decarbonization tool, and about how natural gas utilities can remain ahead of the curve on reducing emissions.