January 3, 2025
2022-2023 Winter Heating Season Performance Survey Overview
- Introduction
The winter heating season, spanning from November 1 to March 31, is the period when the average temperature across the U.S. is expected to be below 65°F. To meet heightened consumer energy demand during these colder months, natural gas local distribution companies (LDCs) develop strategic plans to ensure reliable and safe service.
LDCs have over a century of experience undertaking operational planning and preparation for winter heating conditions. Natural gas supply portfolios are carefully crafted to help ensure reliable natural gas delivery on a daily, weekly, monthly, and seasonal basis, even under extreme or unexpected conditions. Companies plan natural gas deliveries by matching supply resources to forecasted demand and planning for “design day” conditions (or historic peak day load). Utilizing historical data and experience and following regulatory requirements, LDCs employ a full suite of natural gas supply assets and tools to fulfill their obligations.
This analysis offers a brief overview of the 2022-2023 winter heating season based on data from 37 American Gas Association (AGA) member LDCs across 29 states, collected through AGA’s Winter Heating Season Performance Survey. The participating companies reported a cumulative peak day send-out of 26.5 billion cubic feet (Bcf) and an average peak day send-out of 0.70 Bcf per utility. In total, respondents served approximately 23 million sales customers. Compared to the prior survey covering the 2021-2022 winter heating season, this represents a 30 percent decrease from 33 million customers.
Where applicable, comparisons between survey results are presented using percentages to account for the different response rates. In such cases, the percentage of respondents is calculated for each year, and the difference, or difference in percentages, is computed to compare the data. For example, when comparing the percentage of companies sourcing 1-25 percent of their peak day gas supply from citygate purchases for sales customers, 26 percent of companies (10 of 38) utilized this strategy in the 2022-2023 winter heating season, compared to 24 percent (12 of 50) in the previous survey. Despite the smaller total number of companies, this represents a 2 percent year-over-year increase in the proportion of companies using this approach.
It is also important to acknowledge that, even between survey sections, response rates differ. While 37 companies answered all survey questions, 38 responded to the section asking about peak day supply sources. In the previous 2021-2022 survey, interest in this section was also higher, with 51 companies responding but only 48 answering all survey questions.
- Winter Heating Season 2022-2023 Overview
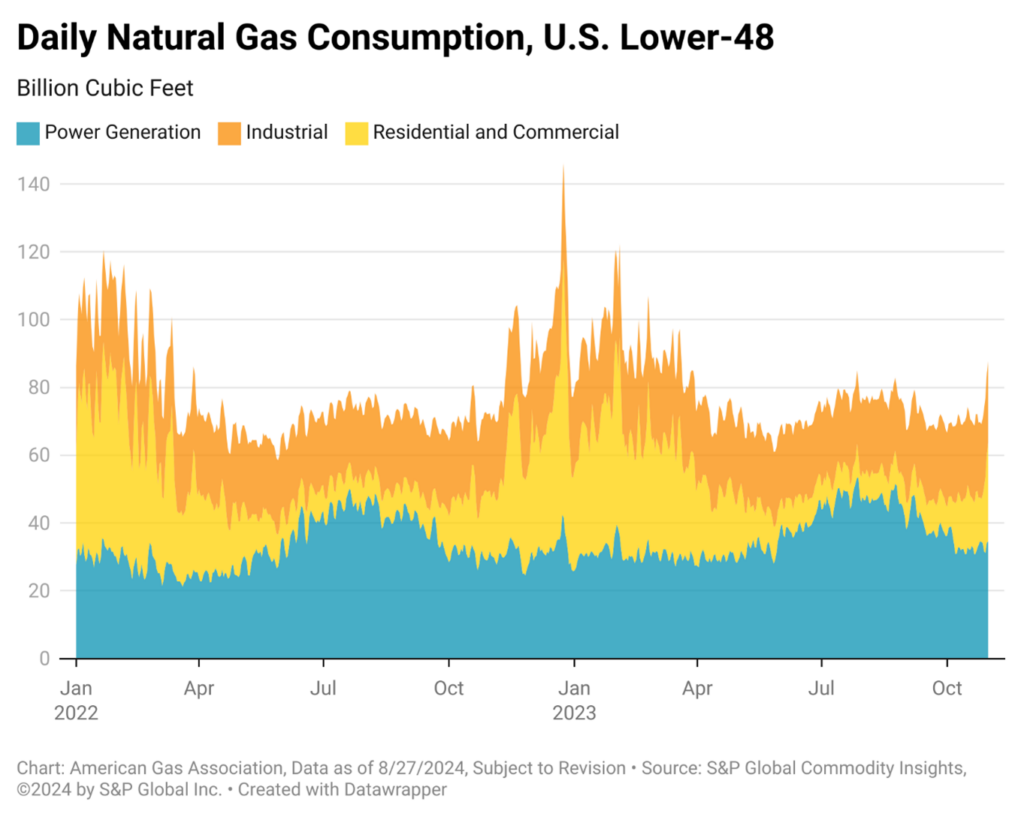
U.S. natural gas consumption is highly responsive to changes in temperatures, so it fluctuates regularly during heating season. As illustrated in Figure 1, there was a significant increase in natural gas consumption on Christmas Eve, 2022, due to Winter Storm Elliott. Elliott swept through the Central and Eastern U.S. from December 23 to 26, 2023, bringing the coldest recorded Christmas in decades to major cities.1 By December 25, more than 55 million people were under wind chill alerts, and by December 26, 250,000 homes and businesses were without power.2 The storm caused approximately $5.4 billion in damage to residential, commercial, and industrial structures, as well as vehicles.3 Elliott exemplifies the volatility in natural gas demand as temperatures sway during the heating season. Peak daily natural gas demand reached 146 Bcf on December 24, but over the following week, demand decreased quickly. By December 31, consumption had waned to 77 Bcf, marking a 47 percent decline in demand over a week.
Figure 1.
The 2022-2023 winter heating season was relatively mild, as reflected in the Heating Degree Days (HDD) data. HDDs measure the relative coolness in temperatures based on how much the daily mean temperature falls below 65°F. In general, 65 degrees is considered the temperature below which residential and commercial buildings begin to make consistent use of space heating. From October 2022 to March 2023, the United States experienced a total deviation of -253 heating degree days from the 30-year normal (1991-2020), indicating a warmer-than-average winter. This continues a five-year trend where each winter season recorded a negative deviation from normal, signaling a shift toward milder winters. In Table 1, red denotes months with warmer-than-normal conditions, while blue highlights months that were cooler-than-normal.
Table 1.
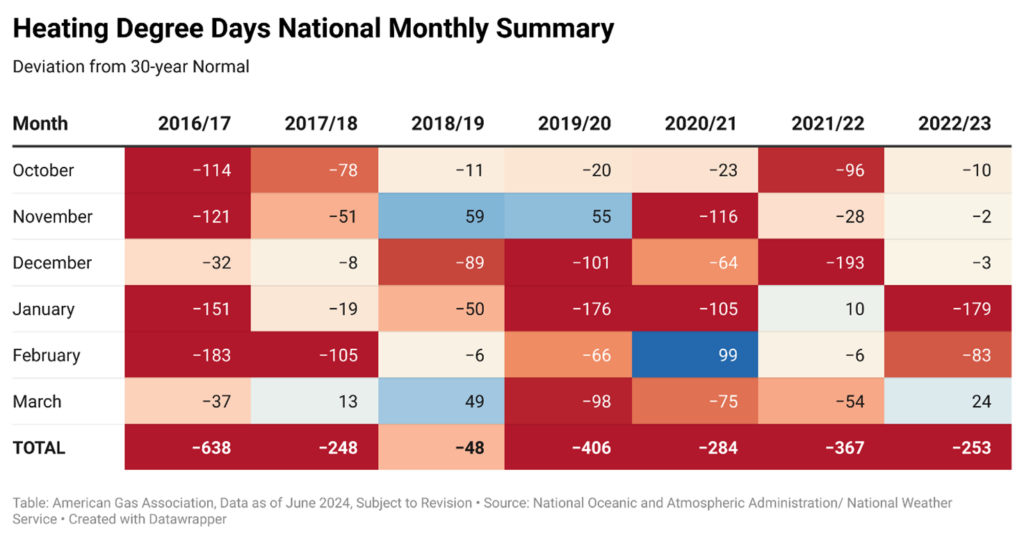
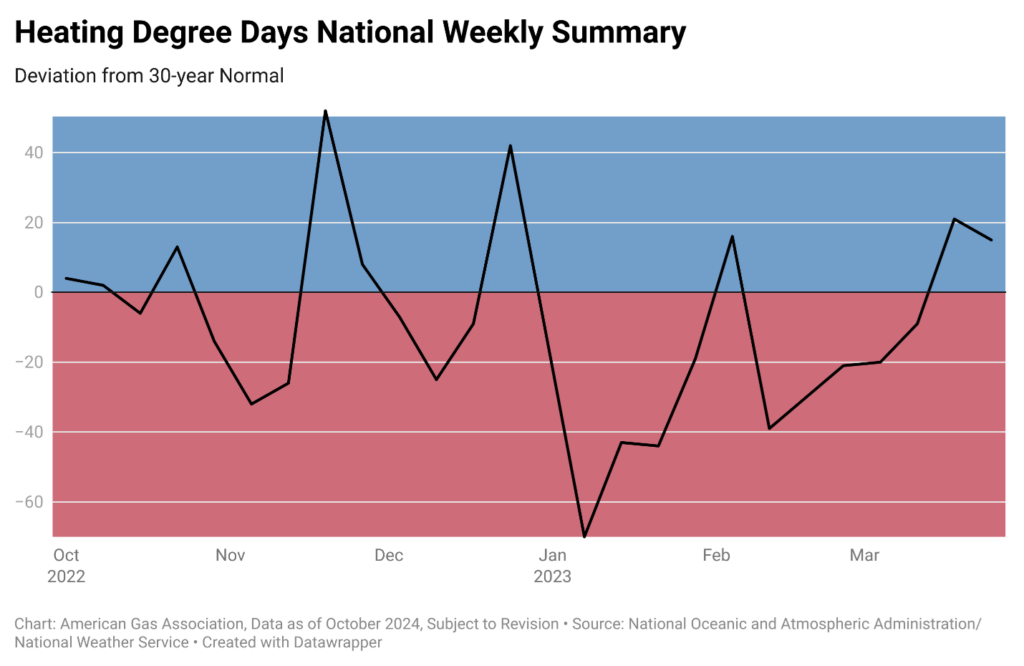
Figure 2 visualizes HDD data, graphing weekly deviations from the 30-year normal during the 2022-2023 winter heating season. As in Table 1, red indicates warmer-than-normal conditions, and blue represents cooler-than-normal conditions. The key distinction between the two graphics is that weekly HDD data captures the impact of extreme weather events more effectively than monthly data because extreme weather events rarely last longer than a few days.
Figure 2.
- Gas Supply Portfolios
Every year LDCs build and manage a portfolio of supply, storage, and transportation services to meet anticipated peak-day, peak-month, and seasonal gas demand requirements. Companies will utilize a number of sources, including citygate purchases for transportation customers, citygate purchases for sales customers, LNG/propane-air/SNG, local production, on-system underground storage, pipeline or other storage, purchases moved via firm transportation, purchases moved via interruptible transportation, asset managed contracts, and other supply sources. Both firm transportation and interruptible transportation purchases exclude storage or local production supplies. In the ‘other’ category, companies reported using supply sources such as linepack, transporter imbalances, and off-system displacement. Local market conditions and geography often determine gas procurement strategies and operations management.
In the 2022-2023 survey, respondents detailed peak day and peak month gas volume deliveries by supply source. Table 2 illustrates the variety of gas supply sources available to LDCs, with pipeline storage and citygate supplies for transportation customers being the most prevalent for both peak-day and peak-month deliveries.
Table 2.
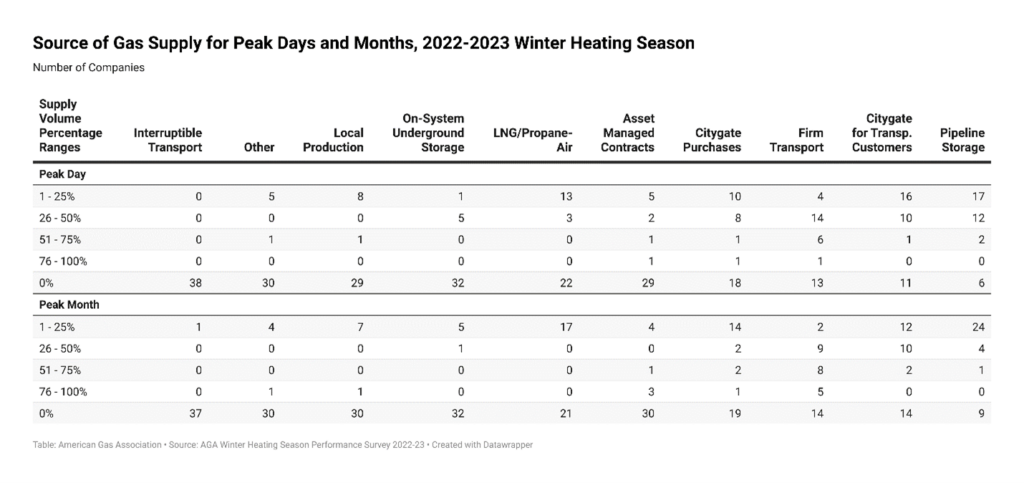
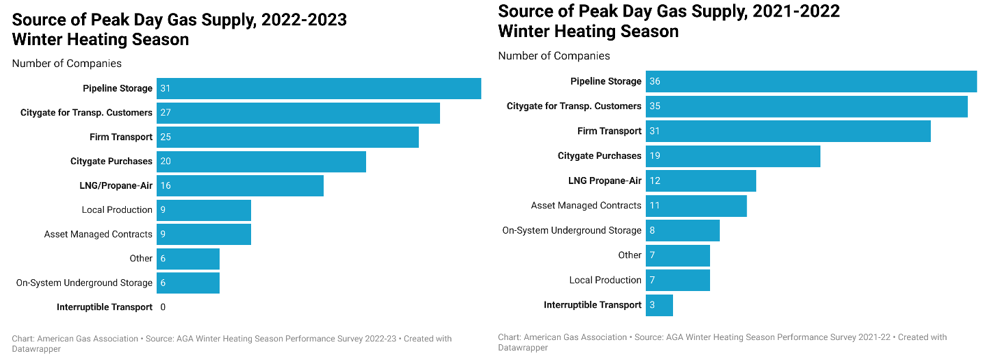
Figure 3 compares supply sources between the 2022-2023 season and the previous winter heating season (2021-2022), showing the source of peak day supplies typically utilized by LDCs remained relatively consistent across surveys.
Figure 3.
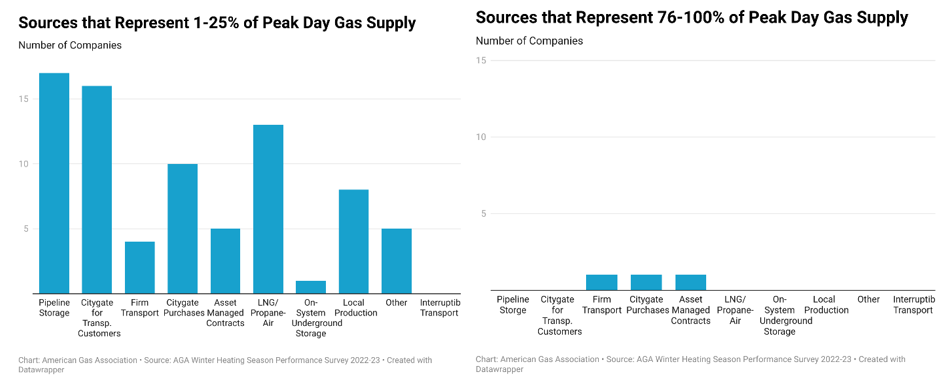
LDCs also tend to emphasize supply source diversity each year. Figure 4 outlines this trend for the 2022-2023 winter heating season. Most companies relied on a range of supply sources, each contributing 25 percent or less to their peak day supplies. This strategy contributes to reliable delivery, effectively managing deliveries in response to changes in consumer requirements with a variety of supply sources.
Figure 4.
Aggregate data also provides valuable insights into supply source strategies across years. Figure 5 illustrates the changes in the percentage of total aggregate supply for all surveyed companies between the 2022-2023 and 2021-2022 winter heating seasons, focusing on peak month. For the 2022-2023 season, there was an increase in the use of pipeline or other storage as well as purchases moved via firm transportation. Conversely, other supply sources and purchases moved via interruptible transportation experienced declines. This trend may suggest a growing preference among LDCs for fully contracted firm supplies to avoid potential interruption during critical events.
Figure 5.
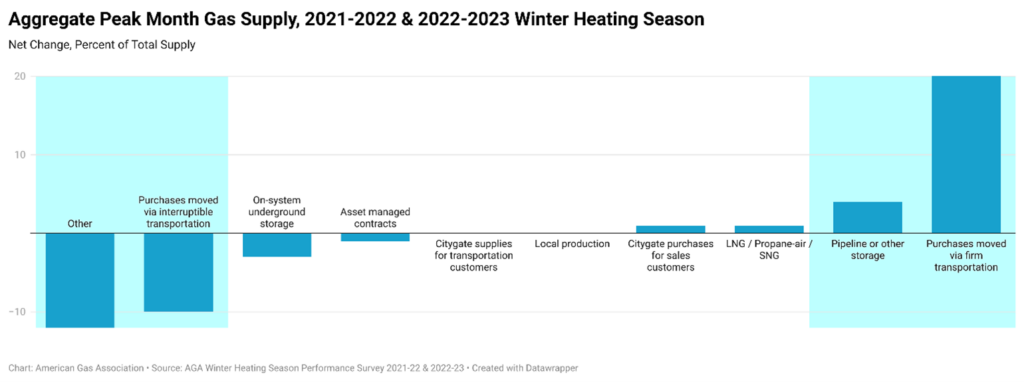
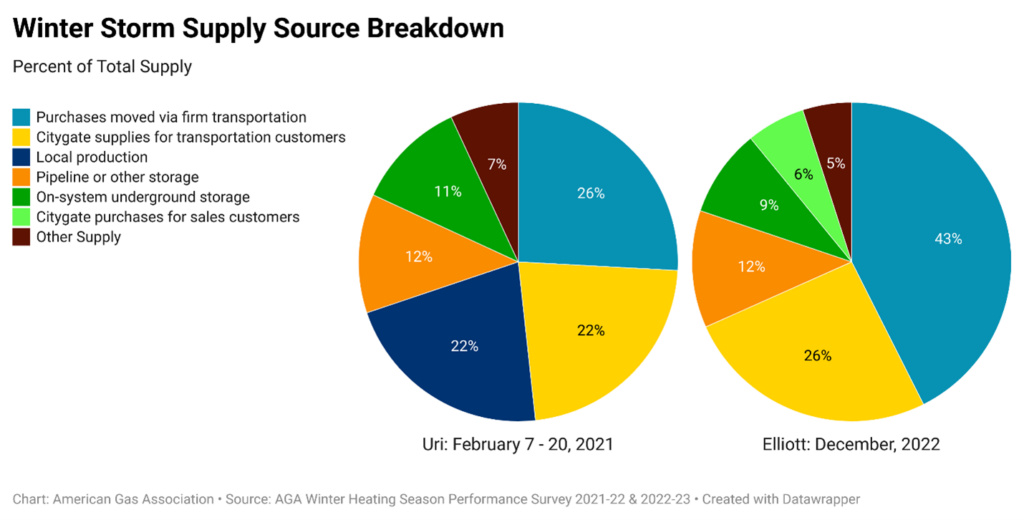
Figure 6 further highlights this trend when comparing source portfolios during Winter Storm Uri and Winter Storm Elliott. During Uri (February 2021), respondents relied heavily on local production, largely due to the storm’s significant impact on Texas, which is home to multiple natural gas production zones. In contrast, during Winter Storm Elliott, there was a greater reliance on purchases moved via firm transportation and minimal use of local production. This shift away from local production during Elliott might have been exacerbated by freeze-offs in the Pennsylvania production area, which limited the availability of gas from that region. Local production is not always available during winter storms, as wellhead freeze-offs can stop or severely reduce production.
Figure 6.
- Contractual Agreements & Purchasing Mechanisms
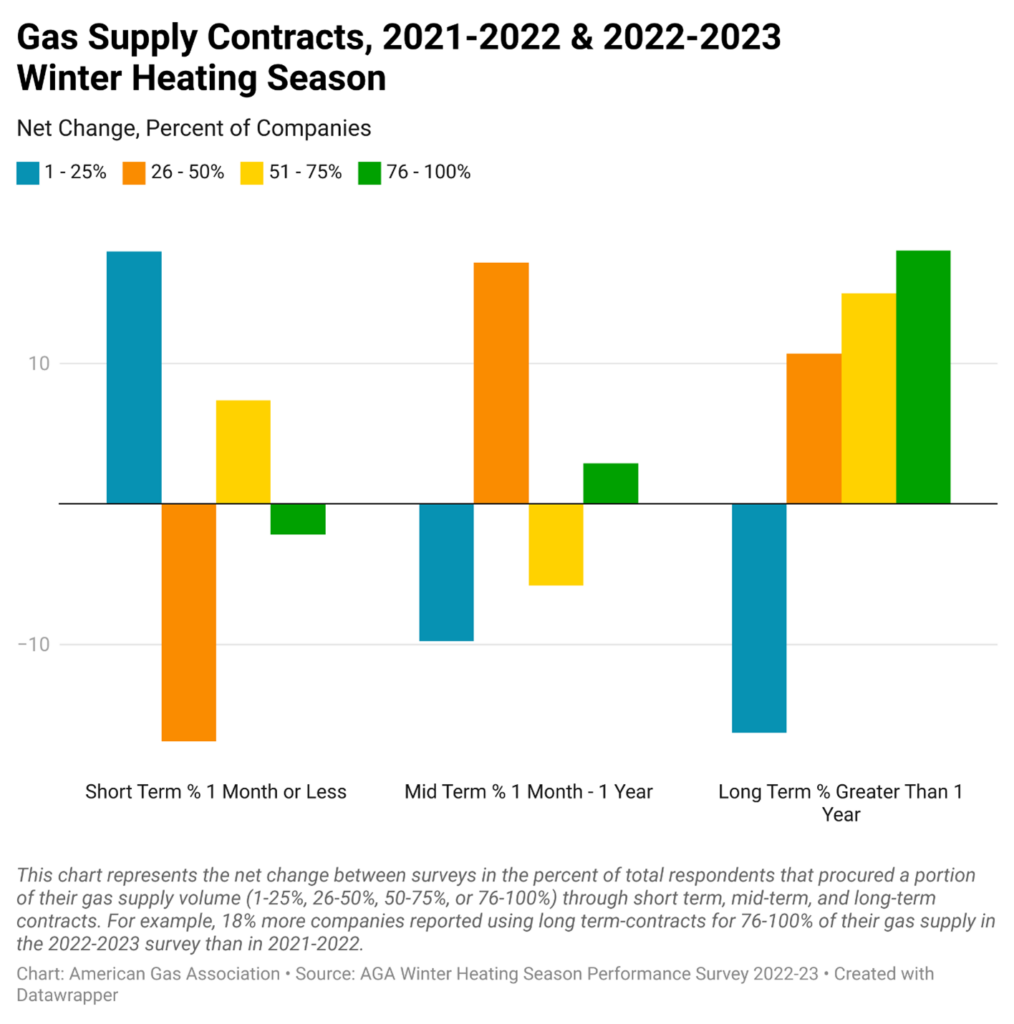
Utilities also employ a diverse set of contractual agreements to secure gas supplies, including long-term, mid-term, monthly, and daily agreements. During the 2022-2023 winter heating season, reliance on long-term supply contracts (terms greater than one year) increased compared to previous years. Figure 7 shows the percentage of companies utilizing long-term supply contracts grew year-over-year for supply volumes between 26 and 100 percent. This trend may indicate a 2022-2023 winter heating season supply strategy aimed at mitigating risk and maintaining supply stability, or it could reflect an increasing baseload demand that necessitates more long-term contracts.
Figure 7.
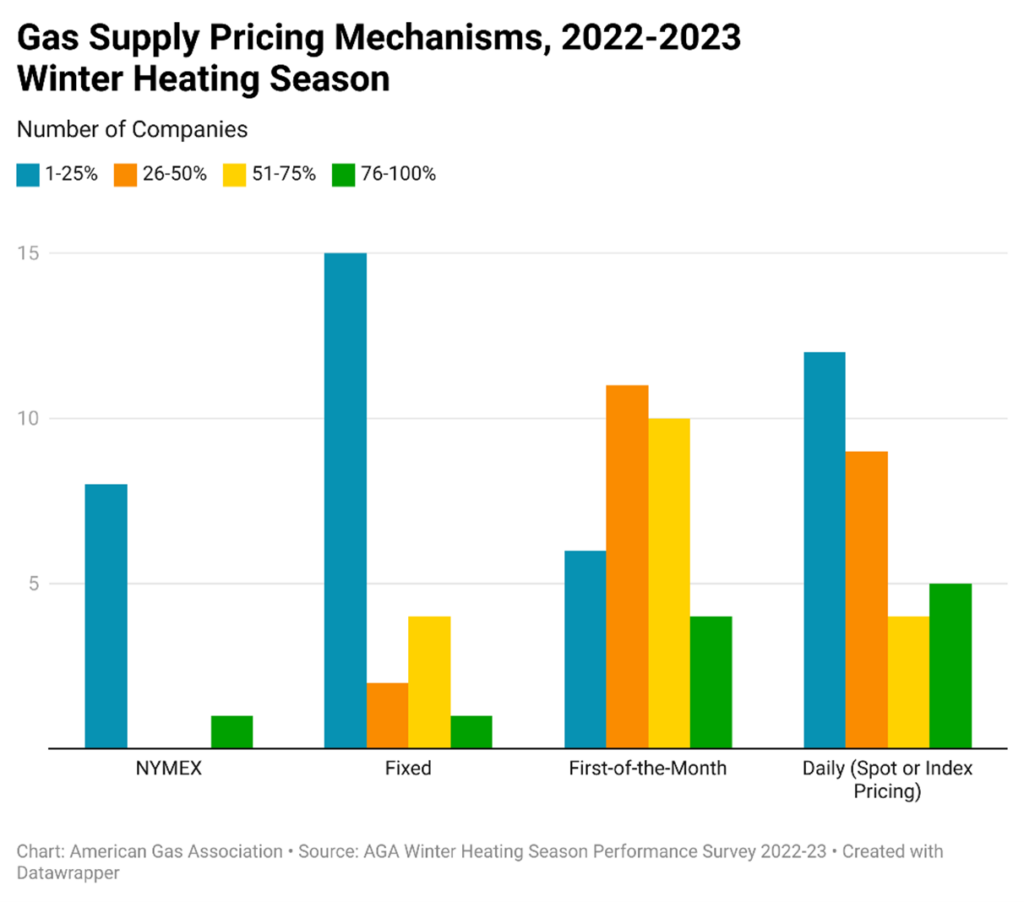
Complementing these contractual strategies, LDCs also use a variety of pricing mechanisms to manage market risks and secure favorable rates. For the past several winter heating seasons, first-of-month index pricing has been the preferred purchasing strategy for the largest portion of supply agreements, a trend that continued during the 2022-2023 season. However, daily pricing mechanisms, such as spot or index pricing, emerged as an increasingly favored purchase strategy. Figure 8 suggests companies may have utilized both first-of-month index pricing and daily pricing mechanisms to make rapid supply adjustments in response to surging demand.
Figure 8.
- Hedging Mechanisms
LDCs use a variety of financial instruments to help offset some of the pricing risk associated with the natural gas market. For the 2022-2023 winter heating season, 62 percent of responding companies (23 of 27) reported using financial instruments to hedge a portion of their gas supply purchases. On average, these companies hedged 30 percent of their total gas supply.
Regionally, 59 percent of responding companies East of the Mississippi River (16 of 27), 63 percent of responding companies in the West (5 of 8), and all responding companies in the Mid-Continent (2 of 2) used financial instruments to hedge a portion of their 2022-2023 winter heating season gas supply purchases. The average volume of total gas supply hedged in each region was 27 percent, 34 percent, and 22 percent, respectively.
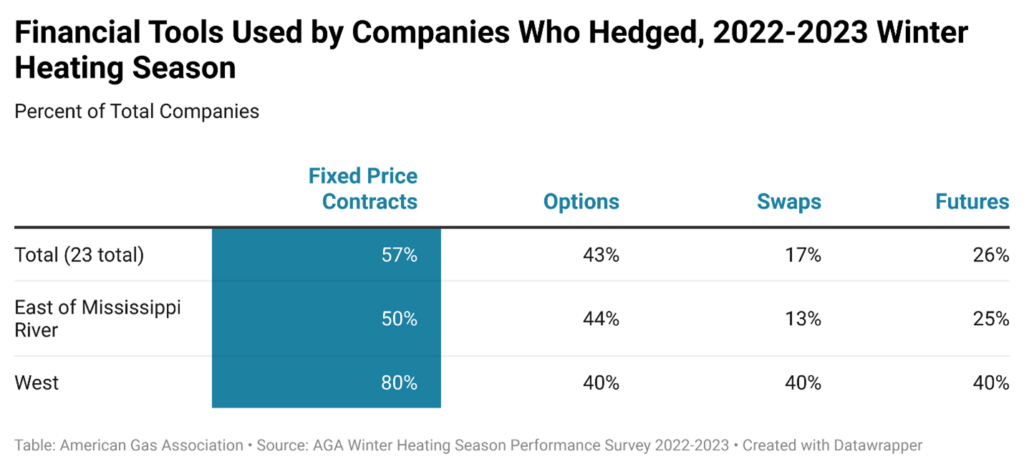
Of the financial tools used for hedging, fixed-price contracts were the most used mechanism for the 2022-2023 winter heating season. Table 3 shows the percentage of companies that used each financial tool, along with a regional breakdown of the data.
Table 3.
When asked about cost recovery, 89 percent of companies (24 of 27) reported all costs associated with hedging were fully recoverable, and 100 percent of companies (26 of 26) stated their regulator treats losses and gains equally. Additionally, when asked about their regulatory environment, 67 percent of companies (22 of 33) indicated there were no restrictions on hedging or financial tools imposed by regulators. However, these restrictions vary by region. Figure 9 reflects this regional breakdown.
Figure 9.

- Natural Gas Underground Storage
Underground storage is a fundamental component of winter heating season supply portfolio planning and management. Depending on the type of facility, storage enables LDCs to meet seasonal demand requirements and short-term demand needs, including peak demand days.
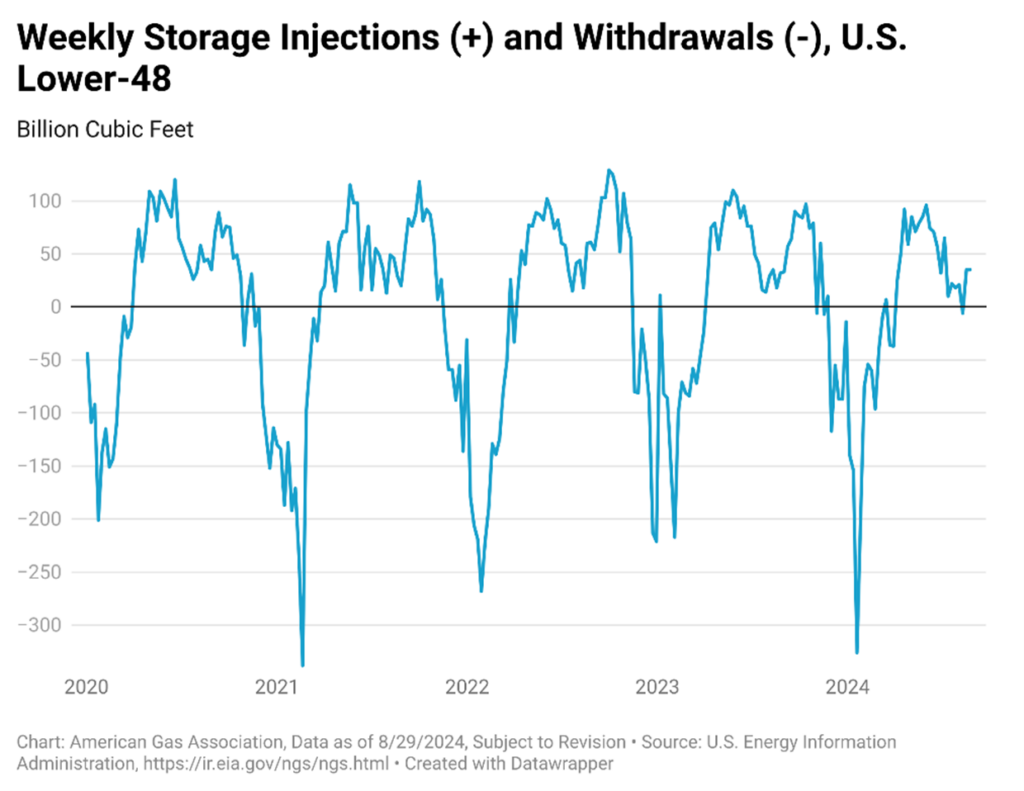
Figure 10 illustrates the cyclical nature of underground storage injections and withdrawals, with withdrawals occurring during the winter heating season and injections typically taking place during the warmer months (April to October).
Figure 10.
For the 2022-2023 winter heating season, 97 percent of companies (36 of 37) used underground—either on-system or pipeline—storage for a portion of their gas supply. On average, these companies sourced 23 percent of their total gas supply from storage. The most common factor influencing the use of storage was weather-induced demand, cited by 76 percent of companies (28 of 37). Other significant factors included pipeline operational flow orders (OFOs), no-notice requirements, and “must turn” contract provisions, which were noted by 41 percent (15 of 37), 41 percent (15 of 37), and 38 percent (14 of 37) of the companies, respectively.
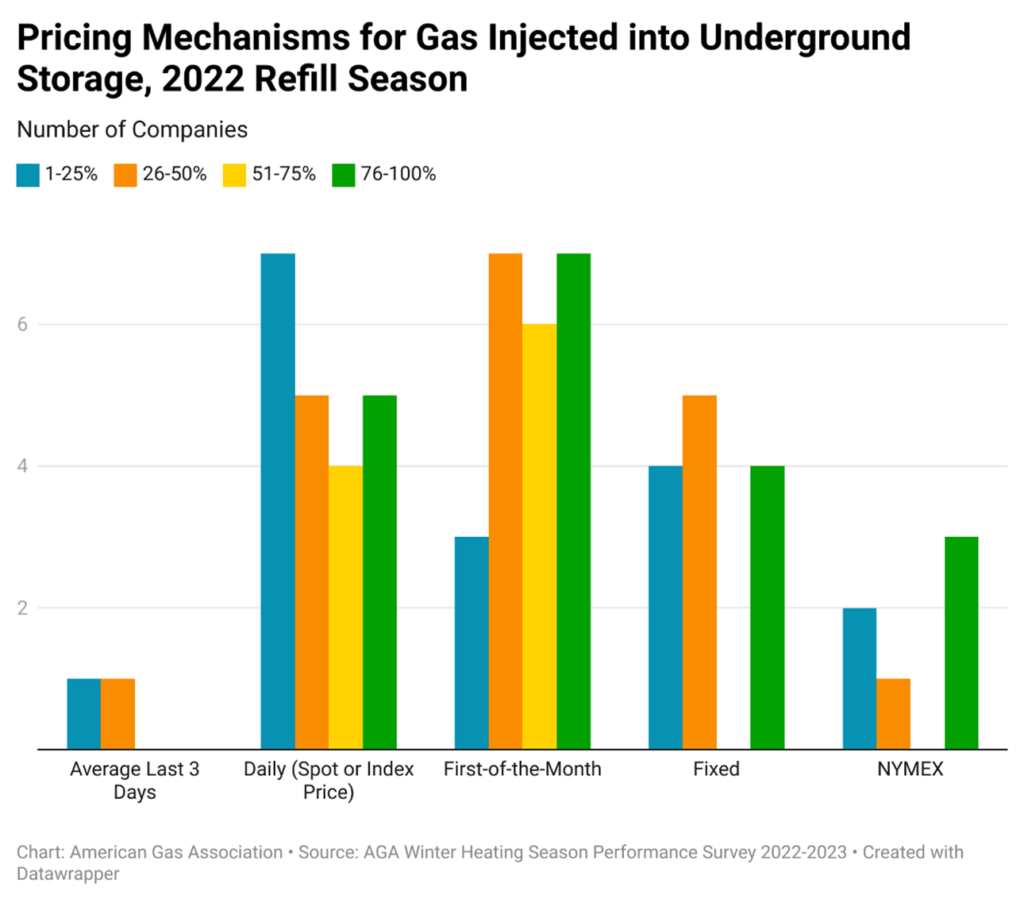
Figure 11 shows that during the 2022 refill season, many gas purchases for storage injections were primarily based on prompt month futures, daily pricing mechanisms, and fixed pricing. Prompt-month futures were the dominant purchasing choice for between 26 and 100 percent of the supply, while daily and fixed pricing were more commonly preferred for 1 to 25 percent of the supply.
Figure 11.
- Pipeline Capacity
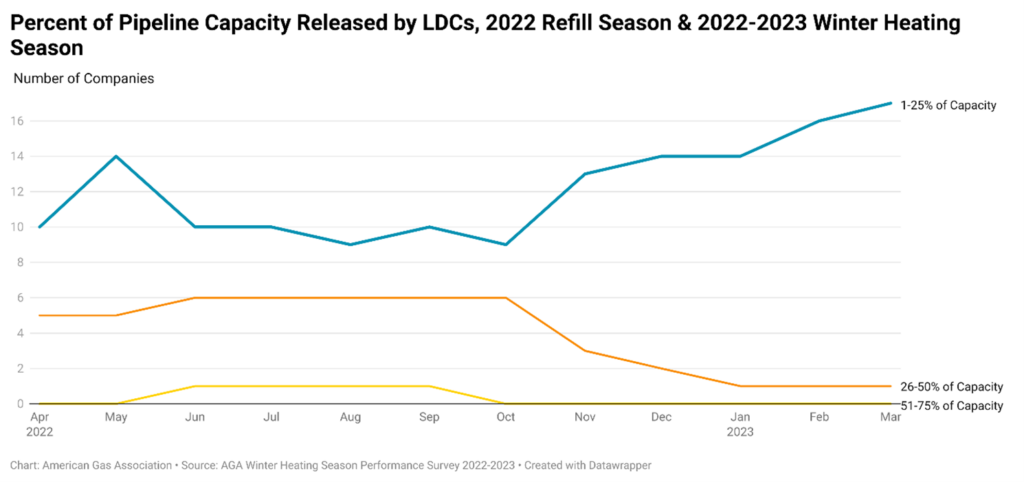
Transportation capacity and gas supply preparation are typically influenced by factors like weather, economic activity, and other variables that impact gas consumption. Figure 12 provides an overview of pipeline capacity management during the 2022-2023 winter heating season, emphasizing the impact of temperature on pipeline capacity releases. While many companies reported they release 25 percent or less of their capacity throughout the year, those that do typically release 26 to 75 percent reduced releases at the start of the winter heating season in November. This shift resulted in an overall decline in pipeline capacity releases, as indicated by the increase in the number of companies releasing only 1 to 25 percent of their capacity during this period, reflecting heightened winter demand.
Figure 12.
- Conclusion
The 2022-2023 winter heating season survey offers valuable insight into the planning LDCs undertake to help ensure reliable and safe natural gas delivery, especially during times of surging demand. The results indicate the growing importance of proactive management and diversified portfolios in response to forecasted demand and market conditions. The shift toward fully contracted firm supplies, increased use of long-term contracts, and reliance on financial instruments for hedging highlight LDCs’ focus on supply and price volatility risk management and operational stability. For stakeholders, these findings underscore the critical need for continuous adaptation and informed decision-making within the natural gas market to help ensure reliability in future heating seasons.
In issuing and making this publication available, AGA is not undertaking to render professional or other services for or on behalf of any person or entity. Nor is AGA undertaking to perform any duty owed by any person or entity to someone else. Anyone using this document should rely on his or her own independent judgment or, as appropriate, seek the advice of a competent professional in determining the exercise of reasonable care in any given circumstances. The statements in this publication are for general information and represent an unaudited compilation of statistical information that could contain coding or processing errors. AGA makes no warranties, express or implied, nor representations about the accuracy of the information in the publication or its appropriateness for any given purpose or situation. This publication shall not be construed as including advice, guidance, or recommendations to take, or not to take, any actions or decisions regarding any matter, including, without limitation, relating to investments or the purchase or sale of any securities, shares or other assets of any kind. Should you take any such action or decision; you do so at your own risk. Information on the topics covered by this publication may be available from other sources, which the user may wish to consult for additional views or information not covered by this publication.
Copyright © 2025 American Gas Association. All rights reserved.