Natural Gas Market Indicators – April 10, 2025
Natural Gas Market Summary
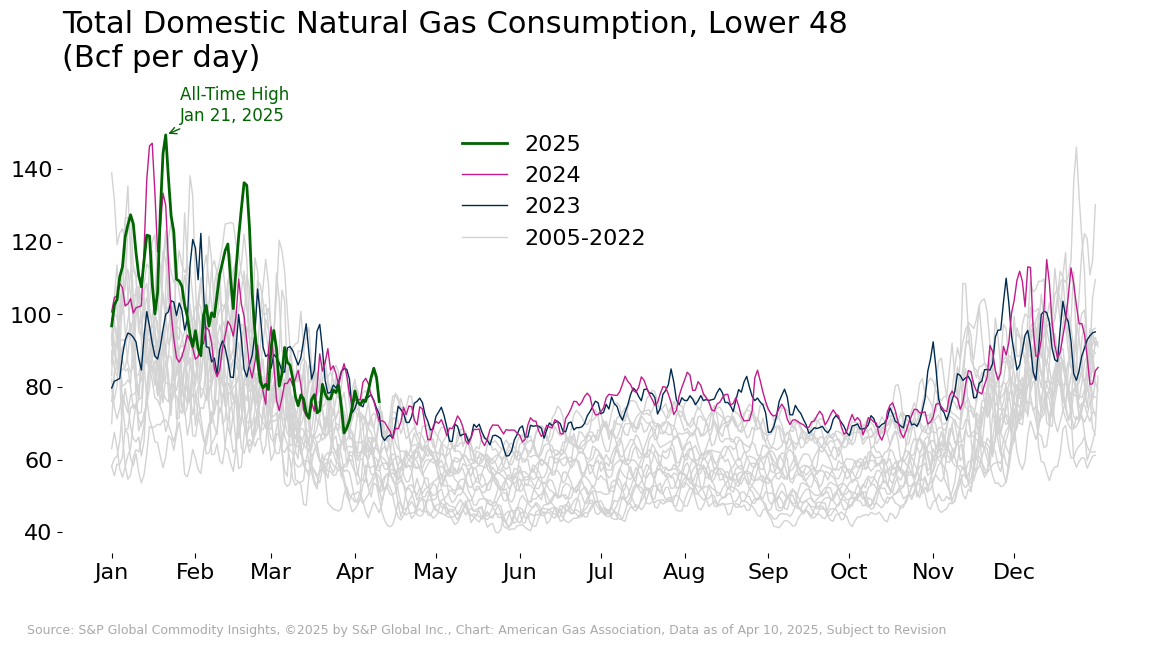
The first quarter of 2025 was one for the record books. Natural gas demand, production, and LNG feedgas deliveries set new monthly records between January and March. At the beginning of the quarter, the coldest January in more than three decades pushed total demand, including exports, to a new monthly high, according to data from S&P Global Commodity Insights. Domestic consumption, spurred by electric power and industrial use, set monthly records in January and February. Lower 48 natural gas production has also ramped up, breaking previous all-time highs in February and March, with dry gas production averaging 106.4 Bcf per day for both months, according to Rystad Energy. Feedgas flows for LNG export are also in record territory as demand at the new Plaquemines facility ramps up and Corpus Christi Stage 3 continues its commissioning activities.
Sustained Year-Over-Year Price Strength
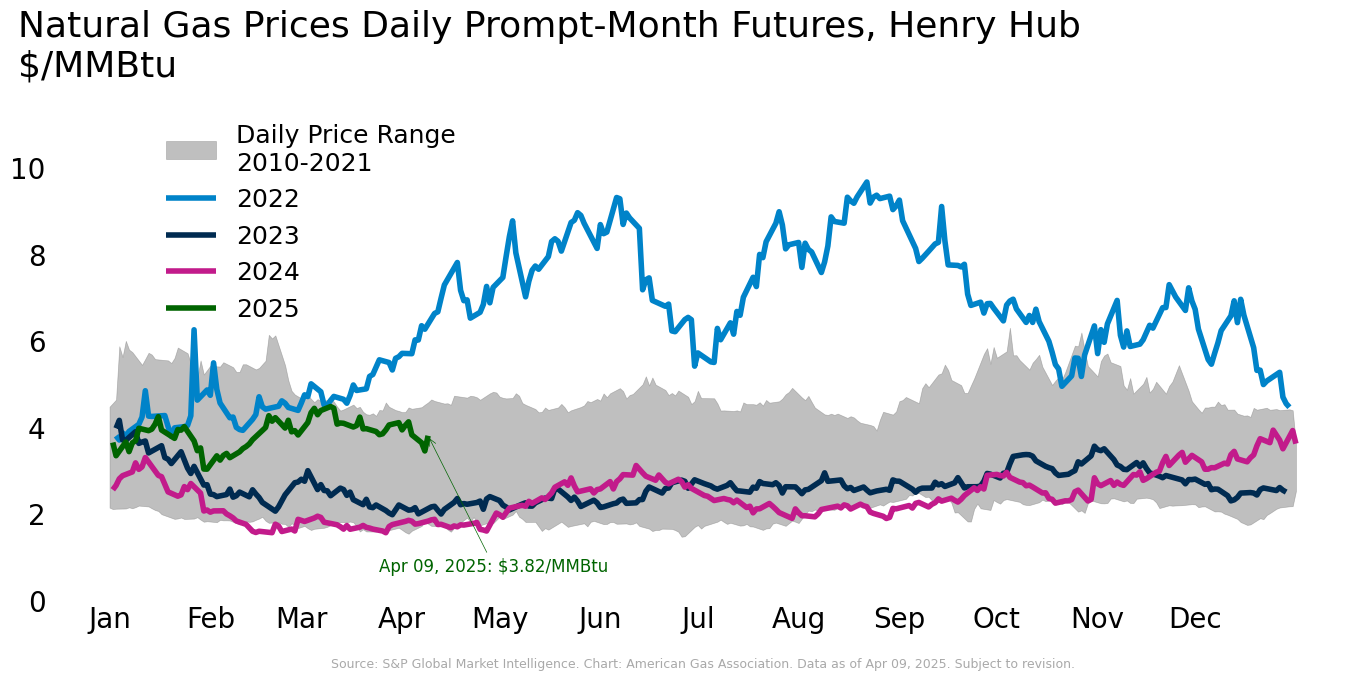
May contracts at Henry Hub dropped to $3.47 per MMBtu on April 8, a decline of more than 16 percent for since April 3, according to data from CME. Thursday morning futures were pricing below $3.70 per MMBtu at the time of this writing. Henry Hub futures prices have struggled to stay below the $4.00 per MMBtu for much of 2025 to date amid high demand and a strong storage draw that brought inventories below the five-year average. For the month of March 2025, futures prices averaged $4.10 per MMBtu, 9.7 percent higher than the prior month and more than double the same month last year. Henry Hub spot prices closed at $3.97 per MMBtu on April 7, 3.6 percent below the March 2025 spot price average of $4.12 per MMBtu. March spot prices were 1.6 percent lower than the prior month but 176 percent higher than the March 2024 average.
Above-Normal Temperatures On the Horizon
Weather in the U.S. was 10.6 percent warmer than last year and 12.2 percent warmer than normal for the week ending April 5, as measured by gas-weighted heating degree days. Regionally, all areas except the West North Central, Mountain, and Pacific regions experienced both warmer temperatures relative to last year and warmer-than-normal temperatures compared to the 30-year normal. For the month of March, the weather in the U.S. was 2.3 percent warmer than last year and 15.1 percent warmer than normal.
The National Oceanic and Atmospheric Administration expects above-normal temperatures into mid-April for much of the U.S. as spring gets underway. Some areas of the Pacific Northwest, New England, and Alaska are expected to largely be near-normal during this time.
Total Demand Up More than 2 Percent Year-Over-Year
Average daily U.S. natural gas demand, including exports, increased 7.3 percent for the week ending April 10 and 8 percent year-over-year, according to preliminary data from S&P Global Commodity Insights. Average daily consumption rose 9.1 percent for the week, driven primarily by a 24.4 percent increase in residential/commercial sector demand. By comparison, electric power consumption increased by 2.9 percent week-on-week, and industrial sector consumption increased by 2.8 percent. Compared to last year, domestic consumption is up nearly 5 percent, driven by a 14.8 percent increase in the residential/commercial sector. Electric power sector consumption is down slightly at 0.2 percent lower than last year’s levels. Meanwhile, industrial consumption is up 1.6 percent year-over-year.
March Production Records
According to preliminary data from S&P Global Commodity Insights, average daily domestic natural gas production posted a loss of 0.5 percent for the week ending April 10. Compared to the same period last year, production is up nearly 4 percent. In March, natural gas production set a new monthly record due in part to increased demand for LNG exports and higher prices relative to the same period last year. Production in the Northeast also reached a new record in March. Compared to last year, Northeast production is up 9 percent.
LNG Feedgas Flows Remain Above Year-Ago Levels
LNG feedgas deliveries hit a record of 17.3 Bcf per day on April 9, according to daily data reported by Rystad Energy. Contributing factors are higher flows into Plaquemines and the continued commissioning activity at Corpus Christi Stage 3 (Trains 1-3). The daily record is on the heels of record year-to-date demand for LNG feedgas. According to the EIA, 28 vessels departed from the U.S. between March 27 and April 2, with a combined carrying capacity of 106 Bcf.
Unusually Strong Storage Injections
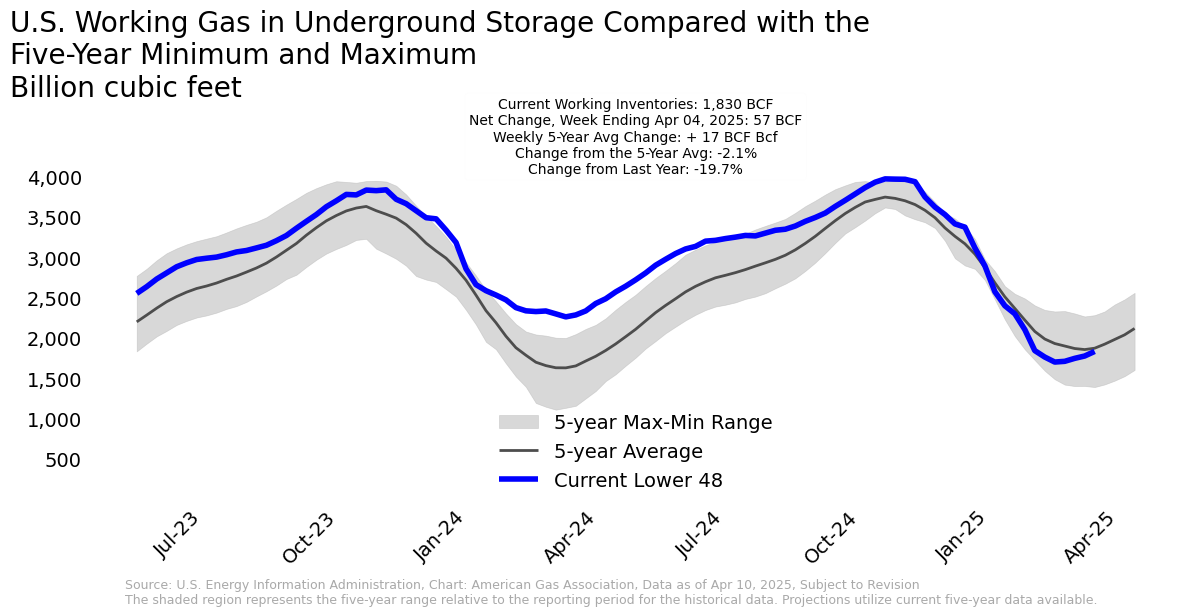
For the week ending April 4, the EIA reports a net injection of 57 Bcf into underground storage, raising total working gas stocks to 1,830 Bcf. Inventories are now 40 Bcf, or 2.1 percent, below the five-year average. After reaching the lowest inventory level of 1,698 Bcf for the season on March 7, net injections into storage have been unusually strong, averaging 33 Bcf per week. For comparison, the estimated five-year average net change to storage inventories over the same period between 2020 and 2024, was a net withdrawal of 16 Bcf per week. All regions experienced net injections for the week except the Mountain region, where inventories remained flat. The largest positive week-over-week change occurred in the East region, where working gas stocks increased by 4.2 percent.
Heightened Canadian Imports
Average daily natural gas imports from Canada increased 31.2 percent for the week ending April 10 relative to last week, according to preliminary data from S&P Global Commodity Insights. Exports to Mexico fell week-over-week by 4.2 percent over the same period. Relative to the same week last year, Canadian imports and exports to Mexico are up 29.7 percent and 6.8 percent, respectively.
Rig Activity Declines
According to Baker Hughes, the total U.S. natural gas rig count decreased from 103 to 96 for the week ending April 4. Compared to the same week last year, the number of natural gas rigs is down by 14 rigs, or 12.7 percent. Total rig count stands at 590, including 489 oil rigs and 5 miscellaneous rigs, down 4.8 percent from last year. By state, the only week-over-week changes to total rig count occurred in Pennsylvania and Texas, with a 1 rig increase and 3 rig decrease, respectively.
What to Watch:
- Prices: Futures prices are below $4 per MMBtu—is this a temporary dip, or will the trend continue, particularly with a strong storage injection for the week of April 4?
- Production: With prices trending above prior year levels and a need to refill depleted storage inventories, will production continue to set records?
- LNG: LNG feedgas set yet another daily record on April 9—will the record setting continue as Europe begins to refill depleted storage inventories following a very cold winter?
For questions please contact Juan Alvarado | jalvarado@aga.org, Liz Pardue | lpardue@aga.org, or
Lauren Scott | lscott@aga.org
To be added to the distribution list for this report, please notify Lucy Castaneda-Land | lcastaneda-land@aga.org
NOTICE
In issuing and making this publication available, AGA is not undertaking to render professional or other services for or on behalf of any person or entity. Nor is AGA undertaking to perform any duty owed by any person or entity to someone else. Anyone using this document should rely on his or her own independent judgment or, as appropriate, seek the advice of a competent professional in determining the exercise of reasonable care in any given circumstances. The statements in this publication are for general information and represent an unaudited compilation of statistical information that could contain coding or processing errors. AGA makes no warranties, express or implied, nor representations about the accuracy of the information in the publication or its appropriateness for any given purpose or situation. This publication shall not be construed as including advice, guidance, or recommendations to take, or not to take, any actions or decisions regarding any matter, including, without limitation, relating to investments or the purchase or sale of any securities, shares or other assets of any kind. Should you take any such action or decision; you do so at your own risk. Information on the topics covered by this publication may be available from other sources, which the user may wish to consult for additional views or information not covered by this publication.
Copyright © 2025 American Gas Association. All rights reserved.