Natural Gas Market Indicators – April 24, 2025
Natural Gas Market Summary
Mild shoulder season weather has eased natural gas prices and demand as the U.S. approaches the end of April. May 2025 Henry Hub contracts are down 25.7 percent to nearly $3.00 per MMBtu as of April 23 for the first time since late December 2024, and the 12-month strip has returned to prices last seen in late January. On the demand side, domestic consumption has fallen 7.4 percent year-over-year, driven by a 19.4 percent decline in the residential and commercial sector for the week ending April 24, according to data from S&P Global Commodity Insights (S&P Global). Weather has also applied downward pressure on natural gas imports from Canada, while exports to Mexico are up 5.1 percent week-over-week. Meanwhile, production continues to grow, particularly in the Northeast and Texas. Rystad Energy reports that dry gas production is on track to reach a new monthly record in April, averaging 106.7 Bcf per day. In addition, domestic natural gas production reached new daily records on April 18, driven by Northeast and Texas production flows, according to S&P Global data. Looking ahead, market participants are monitoring storage levels, maintenance impacts, and power sector demand as the shoulder season progresses.
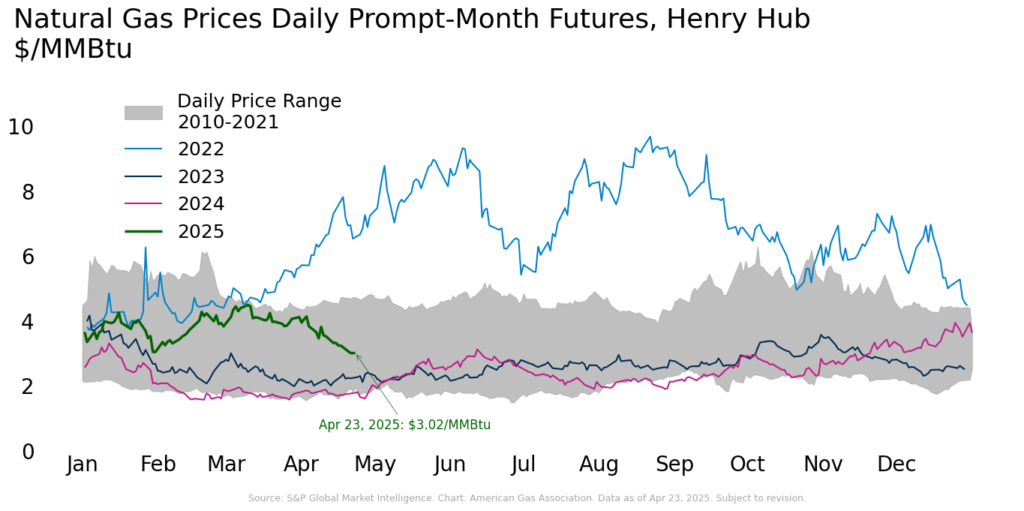
Prices Dip in April After Winter’s End
According to CME, Henry Hub futures prices settled at $3.02 per MMBtu on April 23, down 23.5 percent since April 1 and 32.7 percent since the 2025-to-date high of $4.49 on March 10. Pricing sentiments have turned bearish in light of softer demand brought about by mild weather and healthy production volumes. To date, average Henry Hub futures prices for the month of April are higher than the same period last year but within the historical average. The 12-month strip of $3.76 per MMBtu as of April 23 is down approximately 4.4 percent week-over-week and 18.6 percent since the last day of the winter heating season. Henry Hub spot prices closed at $3.16 per MMBtu on April 21, down 11.5 percent week-over-week, according to the Energy Information Administration (EIA).
Much of U.S. Forecast to See Warm Finish to April
Weather in the U.S. was 13.6 percent warmer than normal for the week ending April 19, as measured by gas-weighted heating degree days, which totaled 76. This period falls within the shoulder season, when milder temperatures typically result in fewer heating degree days before shifting to cooling degree days. Regionally, all areas except the Pacific were warmer than the 30-year normal and all areas except the Pacific were colder than the same period last year.
As April comes to a close, the National Oceanic and Atmospheric Administration forecasts above- or near-normal temperatures across most of the U.S. On the West Coast, temperatures are expected to be near normal, though parts of California, Nevada, and Arizona may experience below-normal conditions. Across the East Coast and Central U.S., temperatures are anticipated to be above normal.
Weekly Demand Falls on Milder Weather
Average daily U.S. natural gas demand, including exports, fell 5.2 percent for the week ending April 24 and declined 1.2 percent year-over-year, according to preliminary data from S&P Global. Over the same week, average daily domestic demand fell 6.6 percent, led by an 25.1 percent drop in the residential and commercial sector following milder weather conditions. Industrial demand also declined, falling by 2.8 percent while electric power consumption rose by 5.3 percent. Year-over-year, all major domestic consumption sectors posted lower demand than during the same period in 2024.
Regionally:
- Compared to last year, consumption fell in all regions except the Southeast, Texas, and Southwest.
- Week-over week, domestic demand decreased in all regions except the Rockies and Southwest.
- The Rockies saw the largest weekly gain, with demand up 13 percent.
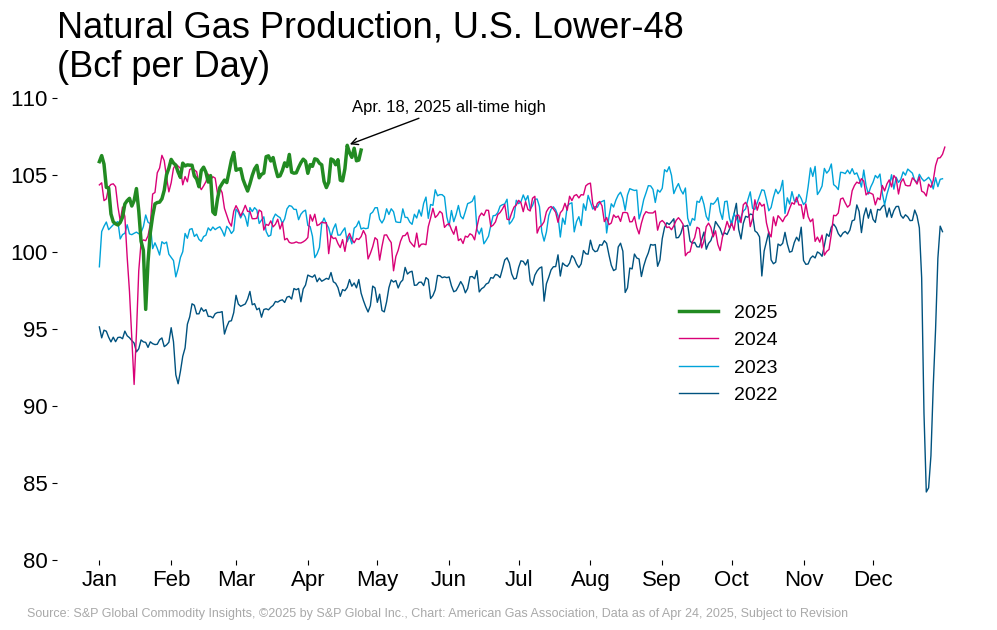
Production Growth Continues
Average domestic natural gas production posted a week-over-week increase of nearly 1 percent as of April 24, according to preliminary data from S&P Global. Compared to the same week last year, production is up 5.4 percent. Production growth is being driven in part by the Northeast and Texas, which posted year-over-year gains of 10 percent and 7 percent, respectively, for the week ending April 24. Domestic natural gas production and production in the Northeast both set new daily records on April 18, according to S&P Global data.
Regional trends for the week ending April 24:
- The Northeast, Midwest, Texas, and Southwest posted week-over-week gains ranging from 0.6 percent to 2.6 percent
- The Southeast, Midcontinent, and Rockies experienced lower production for the week, with the largest decline of 1.2 percent occurring in the Southeast
- Year-over-year, production increased in all regions except the Midwest and Southwest, which posted declines of 5 percent and 0.9 percent, respectively
Feedgas Flows Ease from Record High
According to the EIA, a total of 34 LNG vessels departed the U.S. for the week ending April 16, with a combined carrying capacity of 129 Bcf. This represents an increase of four vessels and 16 Bcf over the prior week. The majority of the vessels left from Sabine Pass. According to preliminary data from S&P Global, LNG feedgas flows for the week ending April 24 are down 2.2 percent week-over-week and 6.3 percent from the daily record set on April 9. Compared to the same week last year, however, flows have increased nearly 38 percent.
The recent dip could be partly due to an unplanned outage at Freeport LNG, which has experienced outages on Train 3 for much of the year to date. One report from Natural Gas Intelligence indicates that Freeport feedgas nominations have been around 1 percent of operational capacity since April 11. In addition, Freeport LNG’s operations had also been affected by a March 2025 lightning strike.
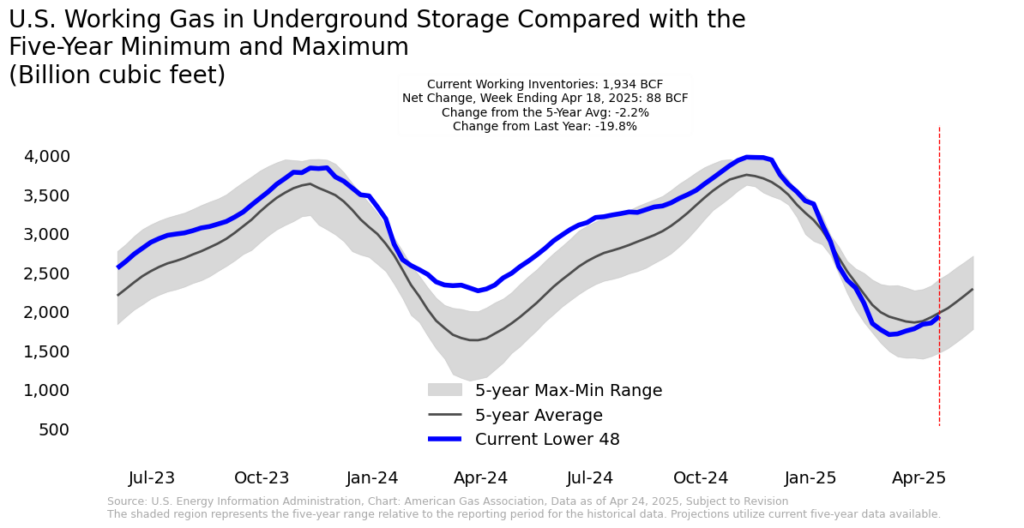
Working Gas Stocks Climb but Remain Below Five-Year Average
The EIA reports a net injection of 88 Bcf into underground storage in the lower 48 for the week ending April 18, bringing total working gas stocks to 1,934 Bcf. All regions posted net injections for the week, with additions ranging from a 1.7 percent increase in the East to a 6.2 percent increase in the Midwest. Relative to year-ago levels, total inventories are nearly 20 percent, or 478 Bcf, lower, with all regions remaining in a year-over-year deficit. Compared to the five-year average, inventories are 44 Bcf or 2.2 percent lower, while regional trends are mixed. Working gas stocks in the Mountain and Pacific regions are above the five-year average, while all other regions are lower.
S&P Global reports that NeuVentus is launching an open season for the first 20 Bcf phase of its Texas Reliability Underground Hub, a greenfield gas storage project in the Moss Bluff salt dome. This open season will serve as a test of greenfield storage economics in a market where rising storage rates have so far favored brownfield developments. According to S&P Global, the CEO of NeuVentus indicated that the company is targeting long-term commitments, particularly from U.S. LNG exporters, which the company views as a key customer group amid surging Gulf Coast LNG demand.
S&P Global also reports that another greenfield initiative recently cleared a significant regulatory milestone with a favorable environmental assessment from FERC in Southwest Louisiana. The Black Bayou Energy Hub LLC’s project plans to develop four caverns totaling 34.7 Bcf of capacity, along with significant infrastructure.
Pipeline Flows Up Relative to Last Year
Average daily natural gas imports from Canada fell by 16.2 percent for the week ending April 22 relative to last week, according to preliminary data from S&P Global. Exports to Mexico increased week-over-week by 2.5 percent over the same period. Relative to the same period last year, Canadian imports and exports to Mexico are up 2.7 percent and 1.9 percent, respectively.
Despite growing trade tensions, Mexico’s reliance on U.S. natural gas is forecast to grow over the next several years with the construction of new gas-fired power plants and rising demand, according to Fitch Ratings. In the Yucatan Peninsula, a 715-kilometer pipeline project is expected to begin operations by mid-2025. Natural gas accounts for 61 percent of electric power generation in Mexico, and more than 70 percent of Mexico’s natural gas consumption is imported from the U.S.
Rig Activity Up Slightly Week-Over-Week
According to Baker Hughes, the total U.S. natural gas rig count increased from 97 to 98 for the week ending April 17. Compared to the same week last year, the number of natural gas rigs is down 7.5 percent, or eight rigs. The total rig count of 585 for the week includes 481 oil rigs, one more than last week, and six miscellaneous rigs. Compared to last year, the total count is down 34 rigs or 5.5 percent.
What to Watch:
- Demand: With warmer-than-normal temperatures expected in parts of the U.S. into early May, will domestic demand remain bearish?
- LNG: LNG feedgas has softened a bit after setting a new daily record in early April – will this be a temporary dip or indicative of a longer trend?
- Storage: How will cooling season demand and strong production trends interact to affect storage refills?
For questions please contact Juan Alvarado | jalvarado@aga.org, Liz Pardue | lpardue@aga.org, or
Lauren Scott | lscott@aga.org
To be added to the distribution list for this report, please notify Lucy Castaneda-Land | lcastaneda-land@aga.org
NOTICE
In issuing and making this publication available, AGA is not undertaking to render professional or other services for or on behalf of any person or entity. Nor is AGA undertaking to perform any duty owed by any person or entity to someone else. Anyone using this document should rely on his or her own independent judgment or, as appropriate, seek the advice of a competent professional in determining the exercise of reasonable care in any given circumstances. The statements in this publication are for general information and represent an unaudited compilation of statistical information that could contain coding or processing errors. AGA makes no warranties, express or implied, nor representations about the accuracy of the information in the publication or its appropriateness for any given purpose or situation. This publication shall not be construed as including advice, guidance, or recommendations to take, or not to take, any actions or decisions regarding any matter, including, without limitation, relating to investments or the purchase or sale of any securities, shares or other assets of any kind. Should you take any such action or decision; you do so at your own risk. Information on the topics covered by this publication may be available from other sources, which the user may wish to consult for additional views or information not covered by this publication.
Copyright © 2025 American Gas Association. All rights reserved.