Natural Gas Market Indicators – April 30, 2026
Natural Gas Market Summary
The natural gas market remains in a seasonal transition, with mild spring temperatures weighing on demand and supporting storage injections at nearly twice the estimated five-year average pace through the fourth week of April. Early-season injections are also tracking at the second fastest pace recorded by the Energy Information Administration (EIA) since 2010. Dry gas production and demand year to date both remain above year-ago levels, though dry gas supplies have grown about three times more in volumetric terms compared with demand year to date. Yet demand is growing, spurred by LNG feedgas as new liquefaction capacity comes online and operates at high utilization.
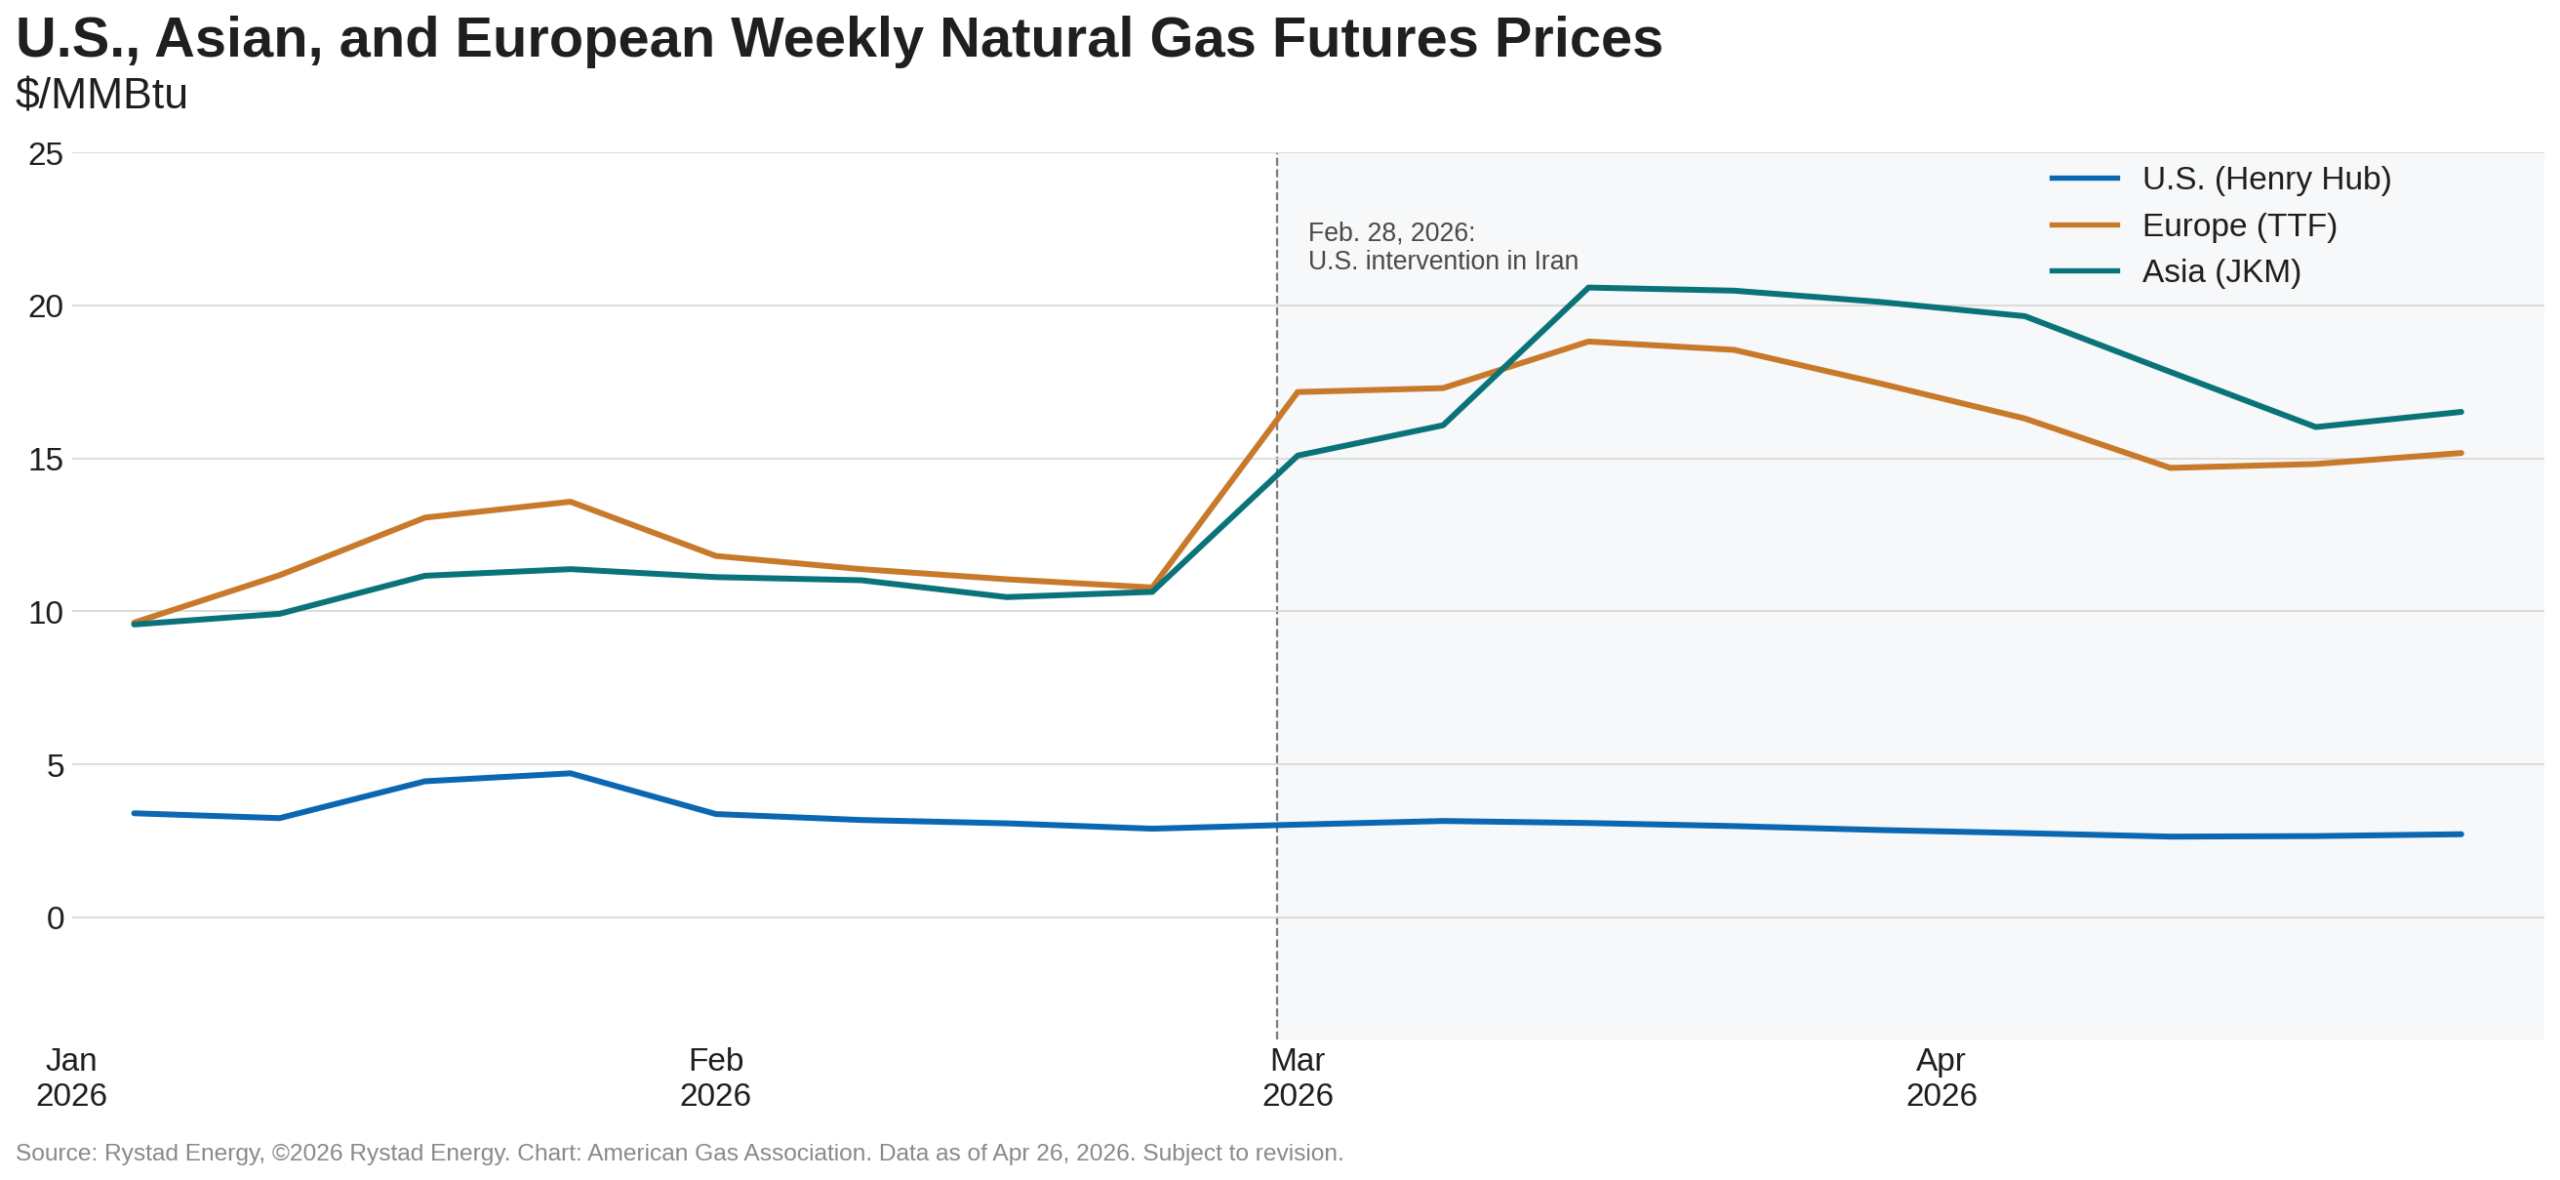
European and Asian natural gas futures remain elevated amid heightened geopolitical tensions. In the weeks leading up to the closure of the Strait of Hormuz on February 28, the price spread between the Dutch Title Transfer Facility (TTF) and Japan Korea Marker (JKM) relative to the Henry Hub prompt month averaged roughly three times higher. Since March, that spread has grown to an average of approximately six times, highlighting the divergence between global and U.S. natural gas markets and the relative stability of domestic natural gas pricing.
Prompt Month Prices Fall to October 2024 Levels
Henry Hub prompt-month futures prices remain below $3 per MMBtu, falling to $2.52 per MMBtu on April 24, a level last seen in late October 2024. The May contract ended slightly higher at $2.56 per MMBtu but remained 9.2 percent below the first trading day of April at expiry. Looking ahead, the 12-month Henry Hub futures strip edges higher over the coming year. As of April 28, futures prices averaged $3.35 per MMBtu over the next 12 months, reflecting a $0.79 per MMBtu spread compared to the prompt month.
However, summer pricing is currently lower than at the start of the year. Average June-August 2026 futures contracts fell more than 17 percent to $2.92 per MMBtu on April 28 from $3.53 per MMBtu as of January 2, reflecting a significant price drop in the prompt-month. On a weekly basis, the Henry Hub prompt month has fallen 20.2 percent since the week ending January 4, according to data from Rystad Energy. At the same time, global markets have seen the opposite trend. JKM and TTF prompt-month prices have risen 72.6 percent and 57.6 percent, respectively.
Mild Conditions May Fade as Summer Heat Builds
Heating and cooling needs remain limited across the U.S. as the shoulder season ends in late April, but the seasonal outlook suggests this summer could be a hot one.
In the near term, the National Oceanic and Atmospheric Administration’s (NOAA) 8-to-14-day outlook predicts mixed temperatures across the U.S. between May 5 and 11. Above-normal conditions are most likely across the West Coast and much of the western U.S., as well as in southern Texas, southern Florida, Alaska, and Hawaii. Near-normal temperatures are forecast for parts of the West, the Southeast, and portions of the Northeast. Meanwhile, below-normal temperatures are favored across much of the central and eastern U.S., with the strongest likelihood centered over the Upper Midwest and parts of the Great Lakes and Ohio Valley.
As the market looks toward summer, NOAA’s latest three-month outlook for May through July favors above-normal temperatures across most of the U.S., with the highest probabilities centered across parts of the West and Southeast.
Exports Offset Weaker Domestic Consumption in April
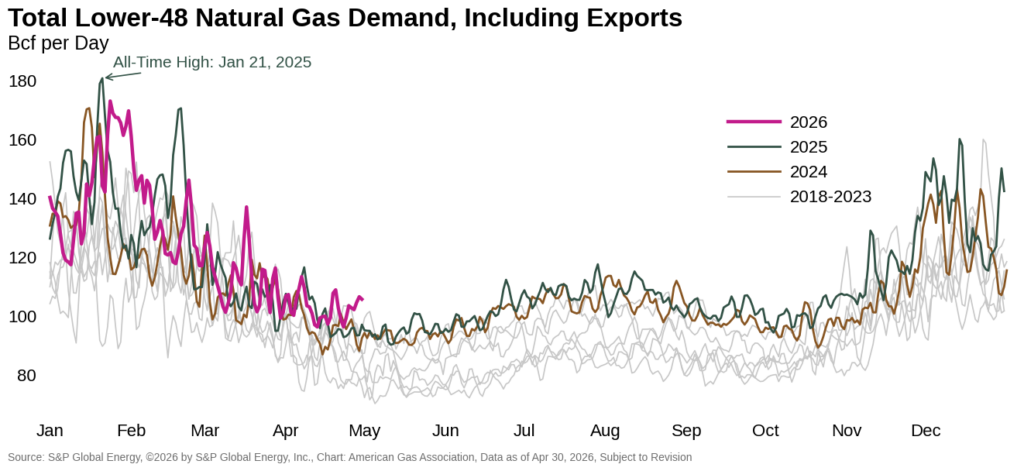
Mild temperatures continue to be a defining factor for domestic natural gas consumption in April. Preliminary data from S&P Global Energy indicate that, month-to-date as of April 30, domestic demand is down 1.0 percent year-over-year. Losses are concentrated in the residential and commercial sectors, where consumption is 13.8 percent below the same period last year. Industrial demand also declined, falling 0,7 percent, while electric power demand increased 8.0 percent. At the same time, exports are driving total demand growth, rising 11.5 percent year-over-year. Overall, total natural gas demand is up 2.8 percent month-to-date and 9.1 percent year-to-date.
April Production Pulls Back, Remains Above Year-Ago Output
Softer natural gas production continues into late April, amid lower prices and mixed rig activity. Dry natural gas production for the month to date through April 30 is nearly 1 percent lower than the same period in March, according to preliminary data from S&P Global Energy. Year-over-year, production is 1.7 percent higher month to date in April and up more than 3 percent on a year-to-date basis.
New Golden Pass Cargo Marks Next Phase of U.S. LNG Growth
LNG feedgas demand remains near record levels, supported by strong global demand and expanding U.S. export capacity. Preliminary data from Rystad Energy suggest LNG feedgas averaged 18.7 Bcf per day for the week ending April 29, down 2.1 percent week-over-week but 17.2 percent above the same week last year. Month-to-date feedgas has averaged 18.9 Bcf per day, up 17.9 percent from April 2025 levels, while the year-to-date average of 18.6 Bcf per day is 19.6 percent above last year’s pace.
The EIA expects U.S. LNG exports to continue rising as new capacity enters service and existing terminals operate at higher utilization rates. Corpus Christi Stage 3 and Golden Pass LNG are expected to add capacity in 2026, with Golden Pass shipping its first cargo on April 22 and becoming the ninth U.S. LNG export terminal. Once complete, Golden Pass will add 2.0 Bcf per day of nominal export capacity.
Global LNG market disruptions are also supporting demand for U.S. cargoes. Analysis from Rystad Energy released on April 24 indicates that the April 7 ceasefire has done little to normalize physical flows through the Strait of Hormuz. While some crude oil, refined products, and LPG volumes continue to move through restricted or bilateral access arrangements, LNG shipments through the Strait have halted completely, keeping global LNG supply constrained and reinforcing demand for cargoes from outside the region, including the United States.
April Storage Injections Reach Second Fastest Recorded Pace
The EIA’s latest Weekly Natural Gas Storage Report suggests that April injections into lower 48 underground storage are occurring at the fastest pace since 2019, totaling 291 Bcf through the first four report weeks of April, ending April 24. This is nearly twice the estimated five-year average injection pace for this period and just 12.3 percent below the record April high of 332 Bcf set in 2019.
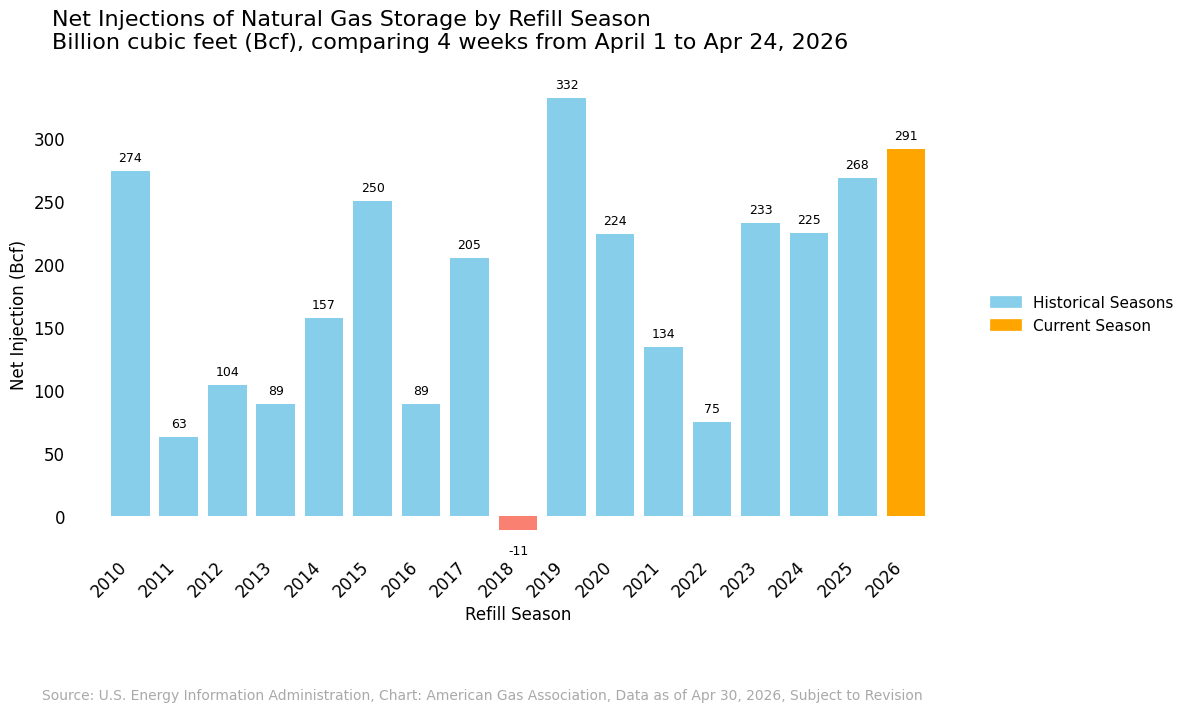
For the week ending April 24, net injections totaled 79 Bcf, raising total working gas stocks to 2,142 Bcf, up 3.8 percent from the prior week. Inventories now sit 7.7 percent above the five-year average, the largest surplus since November 2024. All regions except the East and Midwest are above their respective five-year averages, ranging from 2.0 percent above average in the South Central region to 56.5 percent above average in the Mountain region. Despite remaining below average, the East and Midwest regions have narrowed their respective deficits. The East reached a winter-season low of 17.9 percent below the five-year average for the week ending March 6 and now sits 2.9 percent below average. Similarly, the Midwest reached a low of 18.4 percent below the five-year average for the week ending February 13 and is now 2.3 percent below average. The rapid improvement underscores how quickly storage conditions have shifted as strong April injections offset late-winter regional deficits.
North American Pipeline Flows Ease in Late April
Cross-border pipeline flows declined for the week ending April 28, according to preliminary data from Rystad Energy. Imports from Canada fell 14.0 percent week-over-week to 3.5 Bcf per day, while exports to Mexico declined 10.8 percent to 5.8 Bcf per day. Compared with the same week in 2025, Canadian imports were down 15.8 percent and exports to Mexico were 6.3 percent lower, reflecting softer regional demand amid mild temperatures across North America.
Gas Rig Count Gains After Two Consecutive Weeks of Declines
According to Baker Hughes, the U.S. total drilling rig count rose by one for the week ending April 24, bringing the total to 544. The increase was driven by a gain of four natural gas rigs for the week, offset by a decline of three oil rigs. Total natural gas rigs of 129 remain 20.6 percent higher than year-ago levels, while total oil rigs of 407 trail the previous year by more than 14 percent.
Natural gas-directed drilling activity has gained a total of five rigs since the week ending January 9, 2026, after posting week-over-week losses for roughly half of the last 15 weeks. This growth is largely driven by development in the Haynesville Basin, which has gained 15 rigs so far this year. Rystad Energy reports that the basin is strategically positioned to meet growing LNG feedgas demand.
What to Watch:
- Power demand: Could Henry Hub prices below $3 per MMBtu support stronger natural gas consumption in the electric power sector by encouraging additional coal-to-gas switching as summer cooling demand builds?
- Storage: How might a hotter-than-normal summer affect injections into underground storage, particularly if stronger power-sector demand and sustained LNG feedgas deliveries tighten balances?
- Production: With output softening in April, will cooling demand support a rebound, or could lower prices keep production muted through the summer?
For questions please contact Juan Alvarado | jalvarado@aga.org, Liz Pardue | lpardue@aga.org, or Lauren Scott | lscott@aga.org
To be added to the distribution list for this report, please notify Lucy Castaneda-Land | lcastaneda-land@aga.org
Notice
In issuing and making this publication available, AGA is not undertaking to render professional or other services for or on behalf of any person or entity. Nor is AGA undertaking to perform any duty owed by any person or entity to someone else. Anyone using this document should rely on his or her own independent judgment or, as appropriate, seek the advice of a competent professional in determining the exercise of reasonable care in any given circumstances. The statements in this publication are for general information and represent an unaudited compilation of statistical information that could contain coding or processing errors. AGA makes no warranties, express or implied, nor representations about the accuracy of the information in the publication or its appropriateness for any given purpose or situation. This publication shall not be construed as including advice, guidance, or recommendations to take, or not to take, any actions or decisions regarding any matter, including, without limitation, relating to investments or the purchase or sale of any securities, shares or other assets of any kind. Should you take any such action or decision; you do so at your own risk. Information on the topics covered by this publication may be available from other sources, which the user may wish to consult for additional views or information not covered by this publication.
Copyright © 2025 American Gas Association. All rights reserved.