Natural Gas Market Indicators – August 15, 2024
Natural Gas Market Summary
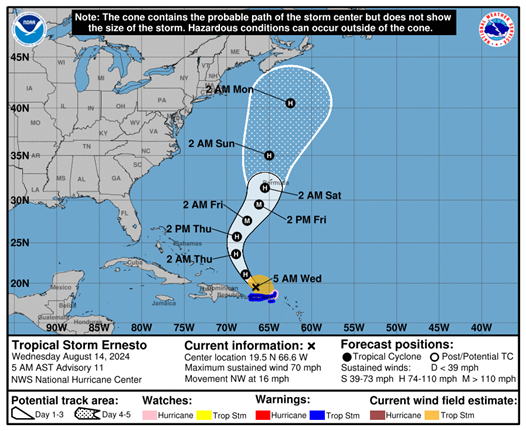
The 2024 Atlantic hurricane season is in full swing. Hurricane Debby made landfall in Florida on the morning of August 5, bringing heavy storms up the East Coast through August 10. Debby presented challenges to utility companies across the coast. As of this writing, Hurricane Ernesto has intensified over the Lesser Antilles and affected electricity service to households on several islands, including Puerto Rico and the Virgin Islands. As Ernesto intensifies, is not expected to affect the U.S. east coast, but a Hurricane Warning has been issued for Bermuda.
Extreme heat has coincided with increased natural gas consumption in the power sector. Similarly, residential and commercial demand increased by 5.6 percent week-over-week, according to the Energy Information Administration (EIA). The EIA’s 2024 August Short-Term Energy Outlook (STEO) highlighted that electric power sector natural gas consumption in July increased by 5 Bcf per day, or 13 percent more natural gas than in June. EIA expects demand in the power sector to decrease in August. The STEO also predicts that production will remain steady, as low Henry Hub spot prices have discouraged excess production.
On August 5, the Department of Energy (DOE) appealed Louisiana Appellate Judge Cain’s July 1 decision to end the pause on expanding LNG exports. Additionally, on July 30, the D.C. Circuit Appellate Court vacated the Federal Energy Regulatory Commission’s (FERC) approval of Transco’s Regional Energy Access pipeline expansion project, stating that FERC did not adequately disclose the reasoning used to dismiss studies that the pipeline might not be needed according to Just the News. This decision, along with the court’s conclusion that there was insufficient demand for natural gas, came despite 73 percent of the capacity being pledged to natural gas local distribution companies and the project being 100 percent subscribed to long-term contracts.
Reported Prices
September Henry Hub futures prices settled at $2.21 per MMBtu on August 14, according to CME. August 2024 futures expired with a final price of $1.91 per MMBtu, which is the lowest August settlement price in 12 years. In July, the benchmark Henry Hub spot price averaged $2.07 per MMBtu. The EIA Short-Term Energy Outlook expects spot prices to average $2.28 per Mcf in Q3 2024 and rise to an average of $2.89 per Mcf in Q4 2024.
Weather
August began as a scorcher, boosting power demand for cooling. For the week ending August 8, temperatures were 6.8 percent warmer than last year and 9.7 percent warmer than the 30-year normal, as measured by cooling-degree days. All regions except West North Central and West South Central were warmer than last year, with the most significant increase occurring in the Pacific region. In the Pacific, there was a 50 percent increase in cooling degree days from 50 to 75 year-over-year. For July, temperatures in the U.S. were 1.9 cooler than last year but 13.4 percent warmer than the 30-year normal.
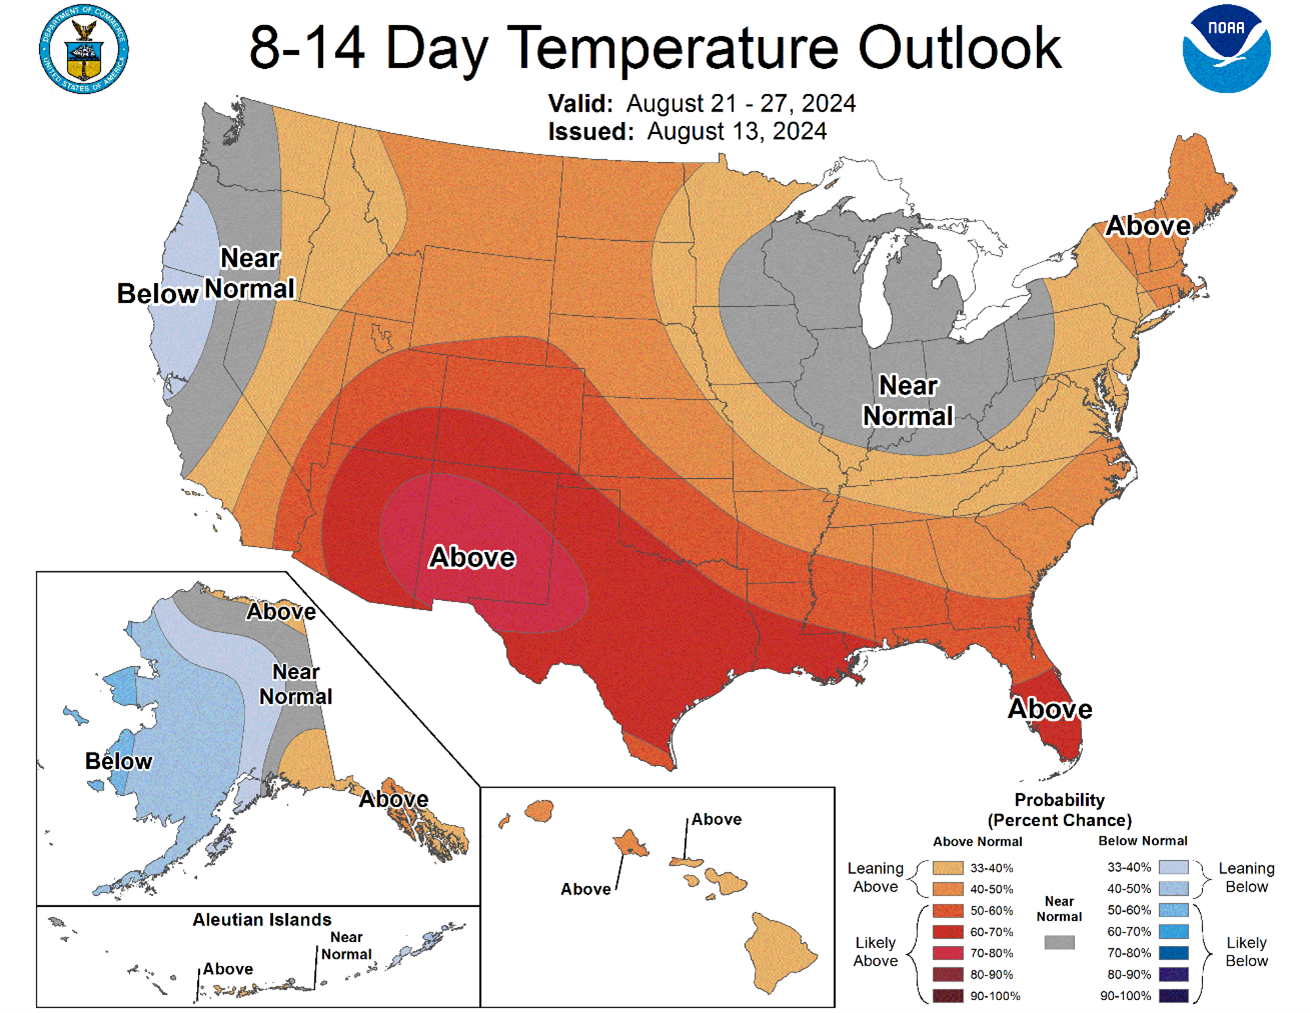
According to the National Oceanic and Atmospheric Administration (NOAA), above-average temperatures are forecast to continue in the South through the weekend. Temperatures along the Gulf Coast and across the Southern Plains are expected to remain in the upper 90s and triple digits. Looking forward to the week of August 21, NOAA expects temperatures in the South and some of the Northwest to remain above average, while temperatures in the East Coast and Midwest are expected to remain near normal or below average.
Hurricane Debby made landfall near Steinhatchee, Florida, on August 5 as a Category 1 hurricane with winds up to 80 miles per hour, according to the NOAA Hurricane Center. Debby brought torrential rain and high winds to large parts of Florida. According to A.P. News, 30 inches of rain fell in some areas, and some cities, including Sarasota, had double the amount of rain that was expected. As Debby moved up the East Coast, tornadoes and flooding damaged homes and took at least 9 lives as reported by A.P. News. In Northern New York, flood warnings were issued through August 10, where up to 7 inches of rain fell. In Florida, 150,000 customers were left without power on the night of August 5, according to Reuters. A.P. News reports that Ohio, New York, Pennsylvania, and Vermont electric customers experienced nearly 170,000 outages due to storms, tornadoes, and flooding.
Hurricane Ernesto began its formation in the central Atlantic and gathered strength as it moved through the Lesser Antilles. Now Hurricane Ernesto, it has left hundreds of thousands without power in Puerto Rico and caused total electrical outages in St. John and St. Croix, according to reporting from USA Today. Current guidance shows no direct threat to the U.S. East Coast, but Bermuda remains in the projected path as Ernesto intensifies.
Demand
According to the EIA, total U.S. consumption at 79.5 Bcf per day rose by 5.6 percent, or 4.2 Bcf per day, for the week ending August 7. In the power sector, consumption increased by 4.1 Bcf per day, from 45.3 to 49.4 Bcf per day. The EIA attributes this 9 percent increase in power generation to above-normal temperatures across the U.S. The week ending July 19 saw similar trends, with consumption in the power sector increasing 1.5 percent week-over-week due to warmer-than-normal temperatures in the Northeast and Midwest regions.
As reported by Reuters, U.S. electricity generators consumed a record amount of natural gas in the first quarter of this year, as natural gas prices remained low. Generators were reported to have produced 1,334 billion kWh between January and April, a 47 billion kWh increase year-over-year. Over 60 percent of the year-over-year increase (roughly 30 billion kWh) was attributed to output from gas-fired units. This increase in gas-fired generation boosted gas consumption to a record of 3,941 Bcf. As reported by the EIA August STEO, the electric power sector consumed 5 Bcf per day, or 13 percent more natural gas in July than June.
Additional growth in energy consumption is expected to occur following the $2.2 billion in DOE funding aimed at boosting the power grid. The funding will impact 18 states with eight projects, as reported by PoliticoPro, and is intended to add 13 gigawatt hours of power capacity, build 600 new power lines, and upgrade 400 miles of transmission infrastructure.
Reuters reported that Enbridge is expecting increased demand following its acquisition of Questar Gas Company and Wexpro, adding over 1.2 million customers and gaining the opportunity to supply energy to a significant number of regional data centers.
Production
For the week ending August 7, dry natural gas production decreased by 0.3 Bcf per day, or 0.5 percent week-over-week, resulting in an average of 103.2 Bcf per day in dry gas production, according to the EIA. Comparatively, for the week ending July 31, production levels reached 103.5 Bcf per day, the highest since March 13, when average production was 102.1 Bcf per day. Production levels are expected to remain close to July levels, according to the EIA August STEO.
According to S&P Global Commodity Insights, Clean Energy Fuels recently completed a $22 million renewable natural gas (RNG) production facility in Lake Benton, Minnesota. This facility now produces and injects RNG into the interstate pipeline system and is expected to provide 480,000 gasoline gallon equivalent of RNG at full capacity.
LNG Markets
For the week ending August 7, natural gas deliveries to LNG export terminals decreased by 0.4 Bcf per day from 13.0 to 12.6 Bcf per day, according to the EIA. Twenty-five vessels with a combined carrying capacity of 94 Bcf departed the U.S. between August 1 and August 7.
On August 5, the DOE filed a notice of appeal before the 5th U.S. Circuit Court of Appeals, aiming to reverse a decision by Louisiana Judge Cain that stayed the DOE’s LNG export pause under the premise that LNG exports are in the public interest. The initial pause and the DOE appeal for new LNG exports came following advocates’ concerns over the environmental impacts of LNG exports, according to the Washington Examiner.
According to Reuters, monthly U.S. LNG exports fell to the second-lowest level of 2024 in July. This fall in exports could be in part due to Freeport LNG closing its facility after the impacts of Hurricane Beryl, which shut down operations at the facility for eight days starting on July 7. The LNG facility in Corpus Christi, Texas, had 30 percent lower feed gas flows from July 16 to July 22, also contributing to reduced LNG production and exports. In July, the U.S. exported 9.96 million metric tons of LNG, which was 5.9 percent less than June LNG exports and 12 percent less than May levels, as reported by Reuters.
Working Gas in Underground Storage
Storage stocks actually decreased by a net of 6 Bcf for the week ending August 9, bringing inventory levels to 13 percent above the five-year average. Underground storage capacity utilization across the U.S. is climbing, with the lowest percentage of utilization at 72 percent in the Midwest and Pacific regions and the highest capacity utilization of 98 percent in the Mountain region. The August EIA Short-Term Energy Outlook projects U.S. end-of-October 2024 inventories of 3,954 Bcf.
Pipeline Imports and Exports
For the week ending August 7, the EIA reports imports from Canada decreased 0.2 Bcf per day, or 3 percent, from the week prior. Exports to Mexico decreased by 0.2 Bcf per day, or 2.6 percent, for the same week.
Rig Count
Baker Hughes reports 588 rigs in operation across the U.S. for the week ending August 9, a week-over-week increase of 2 rigs and up year over year by 73 rigs. The current oil rig count at 485 showed a gain of 3 oil rigs from the prior week and is now down 7 percent from the same week in 2023. The number of gas rigs in operation fell by one rig to 98, down 21 percent year over year.
For questions please contact Juan Alvarado | jalvarado@aga.org or Morgan Hoy | mhoy@aga.org
To be added to the distribution list for this report, please notify Lucy Castaneda-Land | lcastaneda-land@aga.org
NOTICE
In issuing and making this publication available, AGA is not undertaking to render professional or other services for or on behalf of any person or entity. Nor is AGA undertaking to perform any duty owed by any person or entity to someone else. Anyone using this document should rely on his or her own independent judgment or, as appropriate, seek the advice of a competent professional in determining the exercise of reasonable care in any given circumstances. The statements in this publication are for general information and represent an unaudited compilation of statistical information that could contain coding or processing errors. AGA makes no warranties, express or implied, nor representations about the accuracy of the information in the publication or its appropriateness for any given purpose or situation. This publication shall not be construed as including, advice, guidance, or recommendations to take, or not to take, any actions or decisions regarding any matter, including without limitation relating to investments or the purchase or sale of any securities, shares or other assets of any kind. Should you take any such action or decision; you do so at your own risk. Information on the topics covered by this publication may be available from other sources, which the user may wish to consult for additional views or information not covered by this publication.
Copyright © 2024 American Gas Association. All rights reserved.