Natural Gas Market Indicators – August 29, 2024
Natural Gas Market Summary
Higher-than-expected natural gas storage injections for the week ending August 16 and cooler-than-normal temperatures are contributing to softening natural gas futures, according to FX Empire. Futures are trading below both the 50-day and 200-day moving averages, with NYMEX prompt-month futures having found a recent low of $1.88 per MMBtu on August 14 and are still hovering around the $2 mark. Amid concerns of over-supply given existing demand, particularly as cooler temperatures are forecast across the Northeast and Mid-Atlantic, will producers consider slowing production to balance demand?
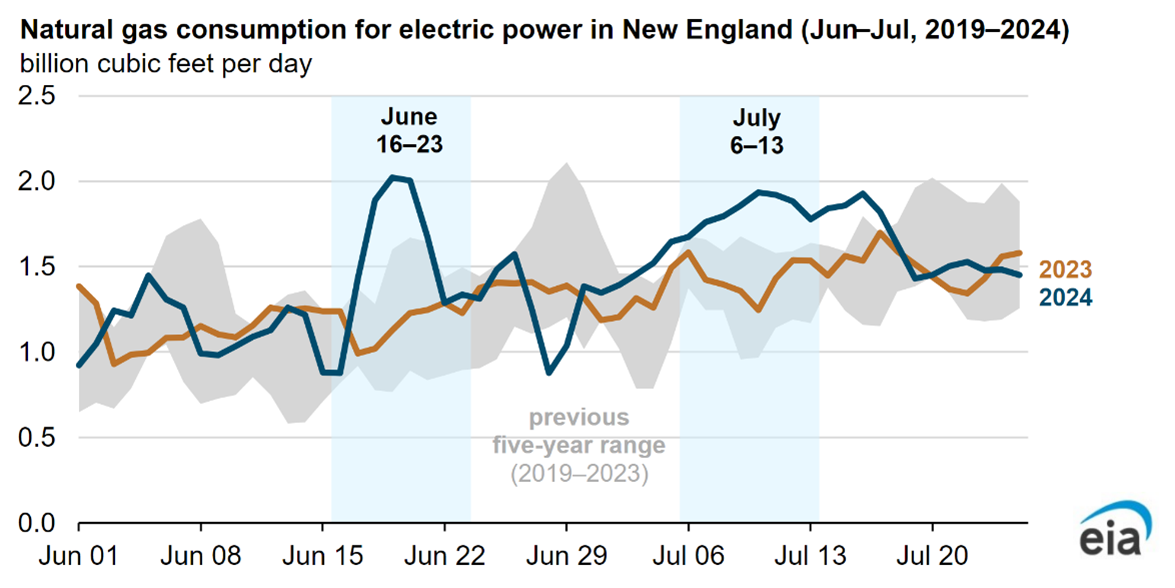
After the hottest June and second-hottest July on global record, gas-fired electricity demand for the summer has reached new heights. Total power burn from June 1 to August 28, 2024, increased by 8.7 percent over the 5-year average, according to data from S&P Global Commodity Insights. The EIA also reports that during the June and July heatwaves, consumption in the electric power sector was higher than any of the last five years in New England.
Reported Prices
September Henry Hub futures settled at $1.93 per MMBtu on August 28, according to CME. In July, the benchmark Henry Hub spot price averaged $2.07 per MMBtu, bringing the year-to-date average spot price to $2.10 per MMBtu. The EIA Short-Term Energy Outlook estimates an average spot price of $2.57 per MMBtu for the remainder of 2024. On an annual basis, EIA projects Henry Hub spot prices may average $3.27 per MMBtu in 2025.
Weather
August has provided some relief from the June and July heat, with temperatures dropping in many areas. For the week ending August 24, U.S. temperatures were 26.4 percent cooler than last year and 15.9 percent cooler than the 30-year normal as measured by cooling degree days. All regions, except the Mountain Region, were cooler than last year. The East North Central Region experienced the most notable change, with a 69.1 percent decrease in cooling degree days, falling from 55 in 2023 to 17 in 2024.
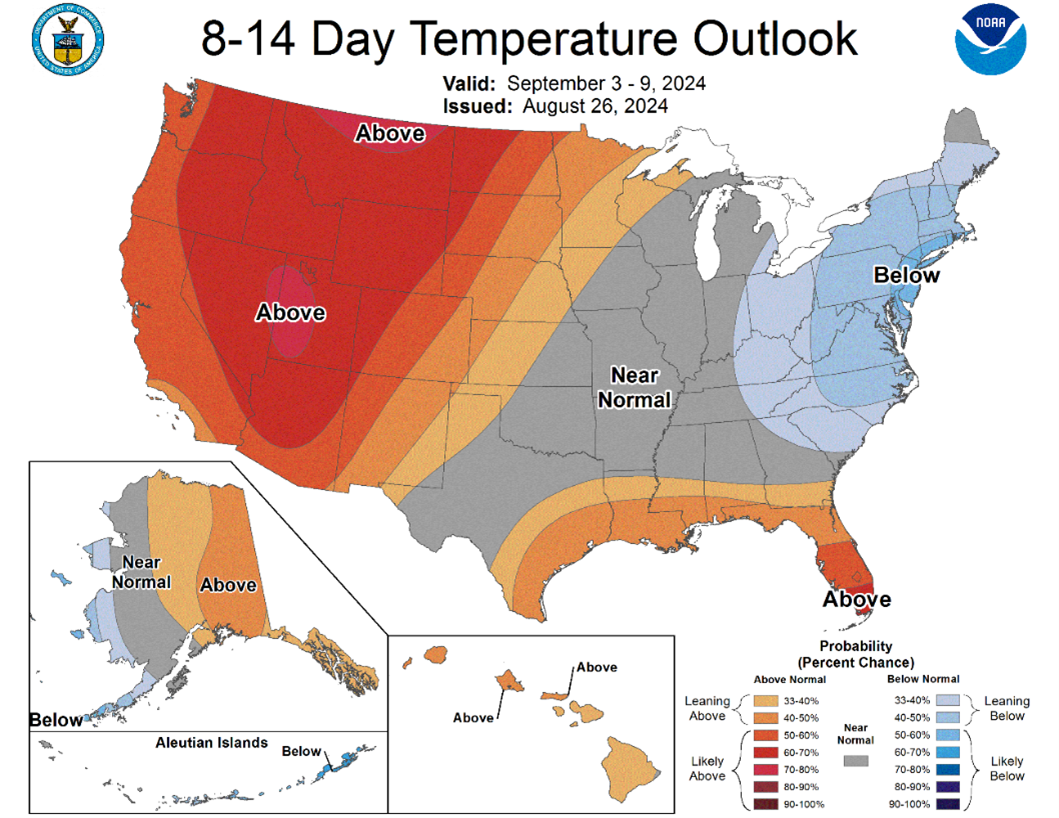
Temperatures this week are scorching over much of the U.S. with 211 million people at or above 90°F on Wednesday, August 28. Looking ahead, the heat dome currently expanding over the Midwest and parts of the East is expected to weaken over Labor Day Weekend. However, temperatures are forecast to rise in the West, as reported by AccuWeather. Following the holiday, NOAA forecasts that temperatures in the Northeast and parts of the Midwest and South will be at or below near-normal temperatures for the week of September 3. In contrast, temperatures are expected to intensify in the West and parts of the South.
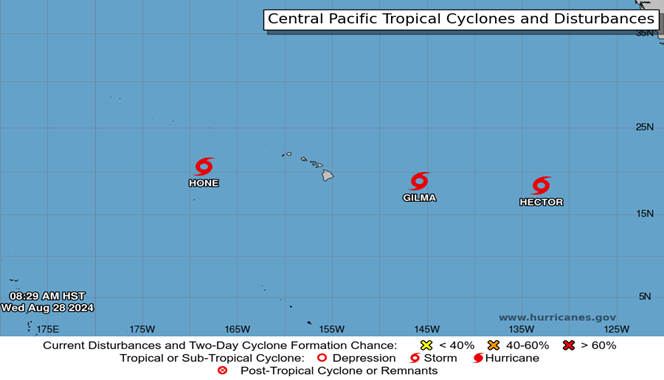
NOAA reports three tropical storms currently active in the Central North Pacific. Tropical Storm Hector has moved away from Hawaii and is forecast to weaken as it heads westward. Similarly, Tropical Storm Gilma continues to lose strength and is expected to pass Hawaii on Friday. North of Johnston Atoll, Tropical Storm Hone is moving west. As of August 29, the NWS has issued advisories for the central North Pacific for each of these storms.
Demand
The EIA reports that total U.S. natural gas consumption rose by 1.6 percent, or 1.2 Bcf per day, for the week ending August 21. In the power sector, consumption increased by 0.8 Bcf per day due to above-average temperatures for the central and southern U.S, aligning with market trends this summer.
Following the scorching temperatures in June and July, total power burn from June 1 to August 28, 2024, increased by 3.1 percent year-over-year according to data from S&P Global Commodity Insights. This marks an 8.7 percent increase over the 5-year average. Additionally, EIA analysis indicates that in New England, natural gas consumption in the electric power sector during the June and July heatwaves was higher than any of the last five years. On June 19 and 20, consumption exceeded 2.0 Bcf per day, placing both days among the top 15 for electric power consumption in New England.
The heat wave is pushing domestic demand higher this week, with flows to the electric power sector likely to reach above 50 Bcf per day across the lower-48.
Production
For the week ending August 21, dry natural gas production maintained an average daily value of 101.3 Bcf per day, on par with the prior week, according to the EIA. Compared to the prior year, weekly average dry natural gas production lagged by 0.2 Bcf per day. For the year-to-date, monthly dry natural gas production has averaged 102.9 Bcf per day, which the EIA expects to increase to 103.8 Bcf per day on average through the remainder of 2024.
LNG Markets
For the week ending August 21, natural gas deliveries to LNG export terminals increased 0.2 Bcf per day to 12.8 Bcf per day relative to one week earlier, according to the EIA. A total of 26 vessels with a combined carrying capacity of 99 Bcf of LNG departed the U.S. between August 15 and August 21. According to EIA, monthly LNG gross exports have averaged 11.8 Bcf per day for the year-to-date and are expected to increase to 12.7 Bcf per day for the remainder of 2024.
Working Gas in Underground Storage
Working gas in underground storage inventory of 3,299 Bcf topped prior week levels by 35 Bcf for the week ending August 16, according to the EIA. S&P Global Commodity Insights reported injections exceeded their weekly forecast by 3 Bcf. According to EIA data, August 16 storage levels surpassed the prior year inventory by 7.2 percent and the five-year average storage inventory by 12.6 percent. Total U.S. storage inventory has increased approximately 46 percent since a seasonal trough for the week ending March 29, 2024. Regionally, the increase in working gas inventory was largely driven by the Midwest, which accounted for 54.3 percent of the week-over-week increase. Storage inventory in the South Central Region remained flat for the week ending August 16. Note that capacity utilization in the Mountain Region is already at 100 percent. Natural gas flows will be looking for avenues other than storage to maintain balance in the market.
Pipeline Imports and Exports
For the week ending August 21, the EIA reports imports from Canada decreased 0.1 Bcf per day, or 1 percent, from the week prior. Exports to Mexico also declined by 3.6 percent, or 0.3 Bcf per day, for the same period.
Rig Count
According to Baker Hughes, there were 586 rigs in operation across the U.S. for the week ending August 13, an 8.7 percent decrease from the same period last year. Compared to the previous week, the number of oil-directed rigs decreased by 2, from 485 to 483, while the number of natural gas rigs increased by 1, rising from 97 to 98.
For questions please contact Juan Alvarado | jalvarado@aga.org, Liz Pardue| lpardue@aga.org, or Lauren Scott | lscott@aga.org
To be added to the distribution list for this report, please notify Lucy Castaneda-Land | lcastaneda-land@aga.org
NOTICE
In issuing and making this publication available, AGA is not undertaking to render professional or other services for or on behalf of any person or entity. Nor is AGA undertaking to perform any duty owed by any person or entity to someone else. Anyone using this document should rely on his or her own independent judgment or, as appropriate, seek the advice of a competent professional in determining the exercise of reasonable care in any given circumstances. The statements in this publication are for general information and represent an unaudited compilation of statistical information that could contain coding or processing errors. AGA makes no warranties, express or implied, nor representations about the accuracy of the information in the publication or its appropriateness for any given purpose or situation. This publication shall not be construed as including, advice, guidance, or recommendations to take, or not to take, any actions or decisions regarding any matter, including without limitation relating to investments or the purchase or sale of any securities, shares or other assets of any kind. Should you take any such action or decision; you do so at your own risk. Information on the topics covered by this publication may be available from other sources, which the user may wish to consult for additional views or information not covered by this publication.
Copyright © 2024 American Gas Association. All rights reserved.