Natural Gas Market Indicators – December 19, 2024
Due to the holidays, the Natural Gas Market Indicators will not be published on January 2. However, NGMI subscribers will receive a copy of the most recent AGA Energy Insights publication.
The Market Indicators team would like to wish you a safe and happy holiday season. NGMI will resume on January 16, 2025. See you next year!
Natural Gas Market Summary
Dreaming of a white Christmas? Chances are low for most of the U.S., which is expected to experience above-normal temperatures as the final weeks of 2024 come to a close. The December 16 National Oceanic and Atmospheric Administration (NOAA) temperature probability map indicates at least a 60 percent chance of above-normal temperatures for the Lower 48 and Hawaii (with the exception of a portion of the Southeast) and a 90 to 100 percent chance for a portion of the northern Midwest around December 25. Warmer temperatures will place pressure on already flagging consumption trends, keeping storage inventories high, and likely softening prices into the holiday season.
The EIA’s December Short-Term Energy Outlook (STEO) forecasts the anticipated year-over-year increase in natural gas consumption in 2024 will wane in 2025. According to STEO estimates, total natural gas consumption is expected to increase 1.6% in 2024, which would set a new annual record. In 2025, consumption is expected to decline by 0.3 percent. By comparison, the EIA projects dry natural gas production will fall by 0.6 percent in 2024 compared to 2023 levels and is not expected to erase those losses in 2025. The electric power sector is expected to remain the largest consumer of natural gas, comprising an estimated 40.9% and 39.2% of total consumption in 2024 and 2025, respectively.
Additionally, the EIA projects both LNG and pipeline gross exports will increase year-over-year in both 2024 and 2025. Gross LNG exports are estimated to increase 0.8 percent in 2024 and 14.2 percent in 2025 due to onboarding of new LNG export terminals. By comparison, gross pipeline exports are expected to increase 3.4 percent and 4.3 percent for 2024 and 2025, respectively. Demand growth and tighter supply are expected to contribute to increased natural gas spot prices in 2025. Henry Hub spot prices are anticipated to average $2.19 per MMBtu in 2024, nearly 14 percent lower than 2023, then increase nearly 35 percent in 2025. With demand growth expected to outpace supply growth, the U.S. could experience a tighter natural gas market in the near term.
Have Prices Peaked Ahead of Warmer Weather Forecast?
January 2025 Henry Hub futures settled at $3.37 per MMBtu on December 18, according to CME. January contracts are trading 5 percent higher than the first trading day in December. The Henry Hub spot price reached $3.11 per MMBtu on December 11, up nearly 10 percent since the prior week, according to NGI data. Regionally, week-over-week spot price changes ranged from a decrease of $0.38 per MMBtu at Northwest Sumas to an increase of $1.86 per MMBtu at Algonquin Citygate.
The Henry Hub spot price reached a 26-year low at $1.21 per MMBtu on November 8, according to the EIA. Since that time, prices have more than doubled. Additionally, Henry Hub spot prices have:
- Increased 30 percent or $0.72 per MMBtu year-over-year as of December 11
- Fallen 15.5 percent year-to-date as of December 11 relative to the same period last year
Mild Holiday Season in Store for Much of the U.S.
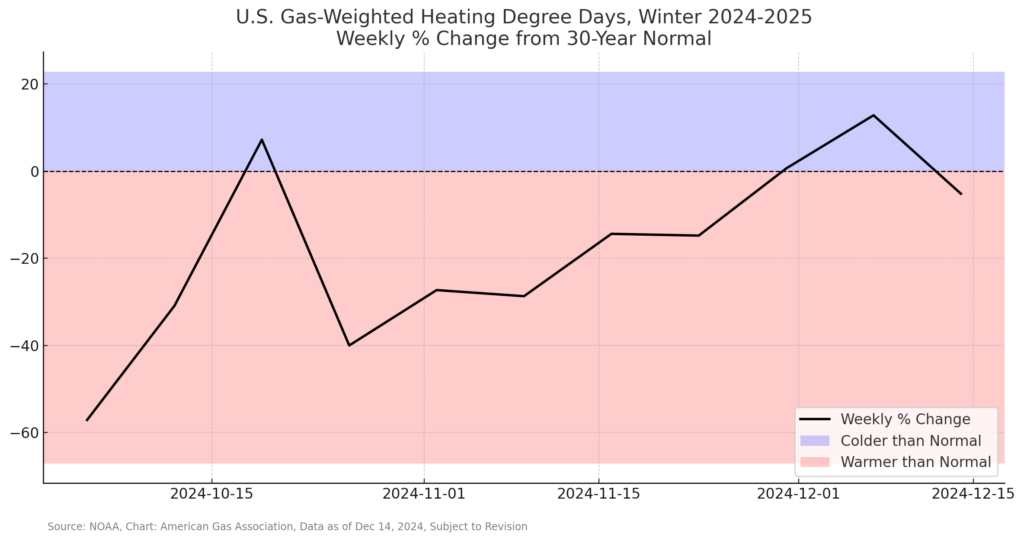
Temperatures across the U.S. have warmed following colder-than-normal spikes between November 24 and December 7, according to heating degree day data. For the week ending December 14, the weather in the U.S. was 11.6 percent colder than last year and 5.2 percent colder than the 30-year normal. Except for the East North Central, all regions experienced above normal temperatures for the week.

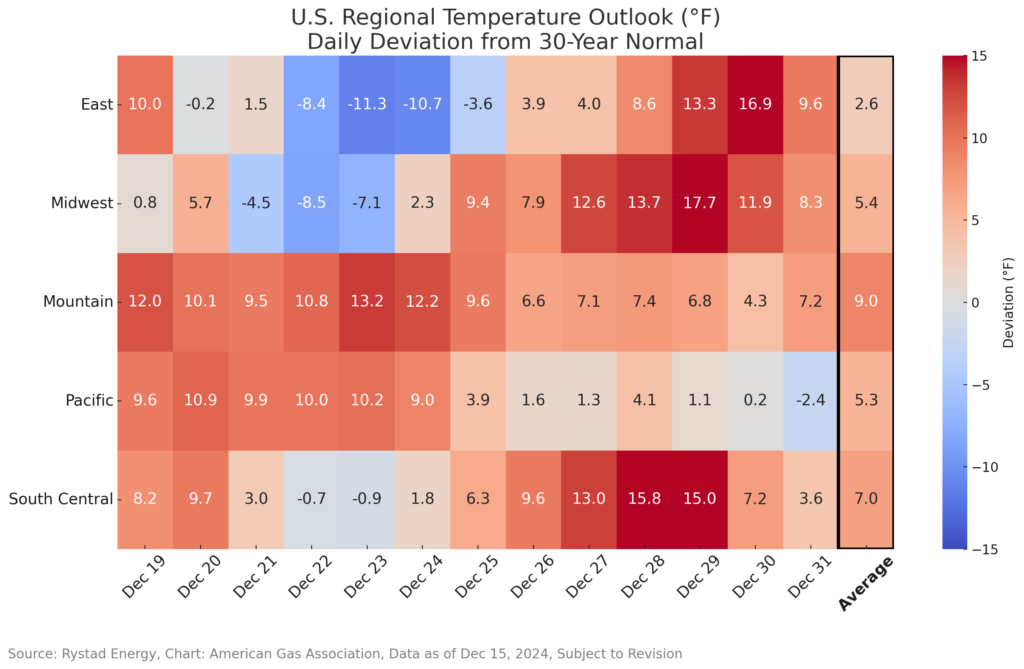
Moving into the holidays, Rystad Energy forecasts temperatures will remain above normal across the Lower 48 states. In the East, Midwest, and South-Central regions, temperatures are expected to be cooler than the 30-year normal between December 21 and 25. In the Pacific, cool temperatures are anticipated at the end of the month. On average, all regions are predicted to be at least 2.6°F warmer than normal for the rest of December.

Warmer-Than-Normal Weather Drives Down Consumption
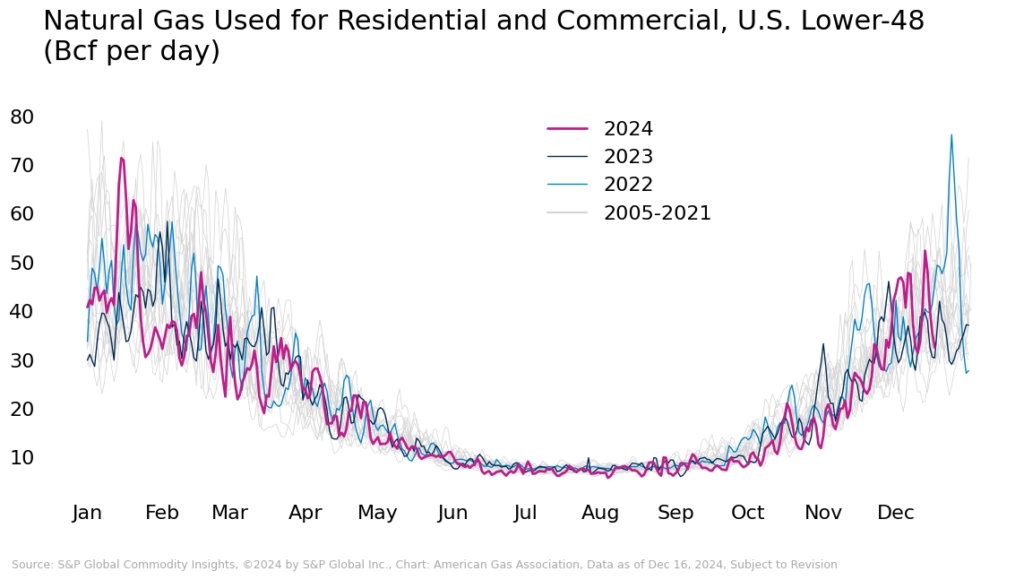
According to the EIA, domestic natural gas consumption fell by 6.8 percent (7.3 Bcf per day) for the week ending December 11, largely driven by a 12.9 percent (5.8 Bcf per day) decline in residential and commercial sector consumption on warmer-than-normal weather. Power sector demand fell by 2.7 percent (1 Bcf per day), and industrial demand declined by 2 percent (0.5 Bcf per day).
Year-over-year trends:
- Residential and commercial sector demand is up more than 14 percent
- Power sector demand is up nearly 8 percent
- Industrial sector demand remains flat

Natural Gas Production Lags Year-over-Year
The EIA reports dry natural gas production increased by 0.6 percent or 0.6 Bcf per day for the week ending December 11. Compared to the same period last year, dry natural gas production is down nearly 1 percent or 0.9 Bcf per day. However, production levels have recovered after above-average hurricane activity disrupted infrastructure on the Gulf Coast and in the Southeast. According to data from S&P Global Commodity Insights:
- Year-over-year production fell nearly 3 percent in November
- December month-to-date production is down 1.3 percent relative to the same period last year
- Production has increased 5.3 percent since the near-term low in mid-November
LNG Feedgas Falling on Softer Production; Plaquemines Begins Production
According to the EIA, 27 LNG vessels with a combined carrying capacity of 102 Bcf departed the U.S. for the week ending December 11, representing an increased carrying capacity of 4 Bcf and one additional vessel week-over-week. Natural gas deliveries to U.S. LNG export terminals decreased by 2.1 percent or 0.3 Bcf per day after rising slightly the week prior. On a global scale, Dutch Title Transfer Facility (TTF) prompt month prices fell nearly 18 percent since its earlier December peak according to FX Street. European natural gas supply uncertainty continues regarding Russian gas flows and lower year-over-year storage levels but could be offset by forecasts of milder weather and increased LNG imports.
For the week ending December 16, LNG feedgas fell by 0.6 percent after declining nearly 3 percent the week before according to S&P Global Commodity Insights. For the year-to-date through December 16, LNG feedgas production is down 0.3 percent relative to the same period last year. However, exports could be buoyed in coming weeks with the commencement of production at the Plaquemines LNG export terminal.
Inventories Remain Strong Despite Large Storage Withdrawals
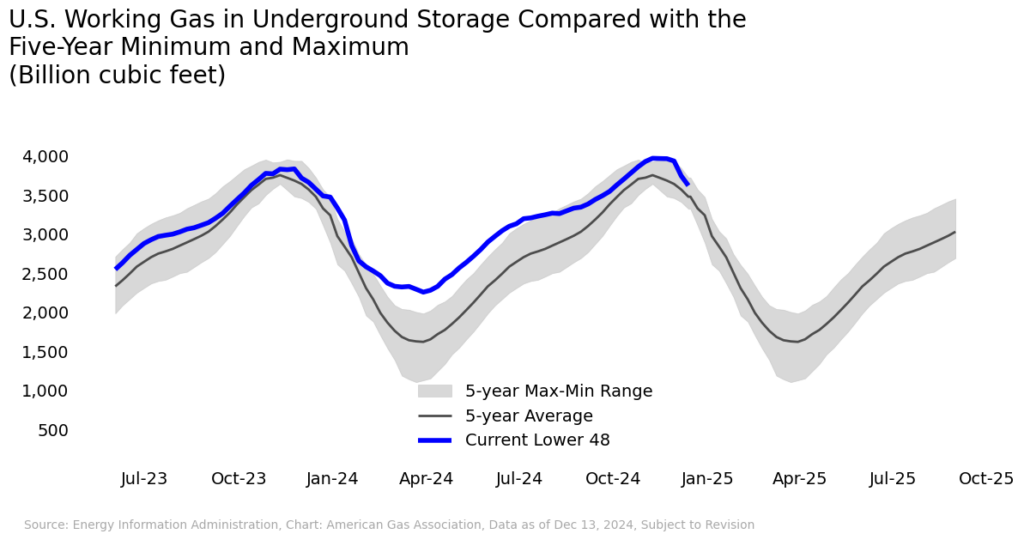
The EIA reports net withdrawals of 125 Bcf for the week ending December 13, reducing total stocks to 3,622 Bcf in the Lower 48. Withdrawals have been strong so far in December, with inventories falling 315 Bcf, or 8 percent, between November 30 and December 13. Despite this decline, storage inventories remain robust at 3.8 percent higher than the 2019-2023 five-year average and 0.6 percent higher than the same week last year. Rystad Energy’s November forecast predicts that withdrawals from underground storage during the winter heating season will average 118 Bcf per week, with the peak withdrawal week expected to occur between January 3 and 31.

North American Trade Flows Fall Week-Over-Week
According to S&P Global Commodity Insights, net Canadian imports and net exports to Mexico both fell for the week ending December 16, declining by 6.5 percent and 3.8 percent respectively. However, compared to the same week last year Canadian imports increased by 25 percent and exports to Mexico increased by 8.5 percent. Natural Gas Intelligence attributes increased Canadian imports to record production levels, relatively low prices, and high storage levels in the country. In the first half of December imports were more than 1 Bcf higher than during the same period last year. Additionally, Western Canadian gas production reached 19.4 Bcf on December 6, beating the prior record of 19.3 Bcf that was set last month.
Natural Gas Rig Activity Sees Modest Increase
Baker Hughes reports 103 natural gas rigs for the week ending December 13, a 1 percent increase over last week and a 13.4 percent decline compared to last year. Oil-directed rigs decreased year-over-year by 3.8 percent.
What to Watch:
- Weather: Mild temperatures may reduce demand and soften prices through the holidays
- Production: Dry gas production is down-year-over-year despite recent recovery, and may remain below 2023 levels in 2025
- LNG: Gross exports are expected to rise with the opening of new export terminals into 2025, which may contribute to a tighter market in the near term
For questions please contact Juan Alvarado | jalvarado@aga.org, Liz Pardue | lpardue@aga.org, or Lauren Scott | lscott@aga.org
To be added to the distribution list for this report, please notify Lucy Castaneda-Land | lcastaneda-land@aga.org
NOTICE
In issuing and making this publication available, AGA is not undertaking to render professional or other services for or on behalf of any person or entity. Nor is AGA undertaking to perform any duty owed by any person or entity to someone else. Anyone using this document should rely on his or her own independent judgment or, as appropriate, seek the advice of a competent professional in determining the exercise of reasonable care in any given circumstances. The statements in this publication are for general information and represent an unaudited compilation of statistical information that could contain coding or processing errors. AGA makes no warranties, express or implied, nor representations about the accuracy of the information in the publication or its appropriateness for any given purpose or situation. This publication shall not be construed as including advice, guidance, or recommendations to take, or not to take, any actions or decisions regarding any matter, including, without limitation, relating to investments or the purchase or sale of any securities, shares or other assets of any kind. Should you take any such action or decision; you do so at your own risk. Information on the topics covered by this publication may be available from other sources, which the user may wish to consult for additional views or information not covered by this publication.
Copyright © 2024 American Gas Association. All rights reserved.