Natural Gas Market Indicators – February 14, 2025
Natural Gas Market Summary
A parade of winter storms is impacting much of the U.S. this week, which may reinstate heightened levels of natural gas demand similar to those experienced during January’s Arctic Blast. As of February 13, natural gas futures prices have risen as the storms roll in, up 19.2 percent from the last trading day in January. Storage inventories have fallen below the five-year average, indicating the strong demand for natural gas in January. While strong storage withdrawals may be a bullish pricing indicator, rebounding domestic production may offset some of that sentiment.
Notably, this month, the President of the United States announced a 10 percent tariff on energy imports from Canada, including natural gas, but implementation of the tariff is currently paused until early March. Canada supplies approximately 9 percent of the U.S. natural gas market. Imposing a tariff on these imports could drive up commodity costs, alter supply sources, shift pipeline flows and demand, and create other potential disruptions. Border states that rely heavily on Canadian natural gas—some sourcing their entire supply from Canada—are particularly vulnerable to the tariff’s impacts. Depending on the assumed price of Canadian imports, the tariff could raise U.S. natural gas costs for consumers by hundreds of millions to over a billion dollars.
Prices Climbing on Colder Weather Forecast, Below Average Storage Levels
March 2025 Henry Hub futures prices settled at $3.63 per MMBtu on February 13 according to CME, up more than 6 percent week-over-week. Premarket, Henry Hub futures flirted with $3.76 per MMBtu on February 14 before opening at $3.65 per MMBtu. As of February 10, the EIA reports a Henry Hub spot price of $3.48 per MMBtu, up 5.5 percent week-over-week.
Regionally, limited pipeline capacity along the East Coast may impact price volatility as the winter storms continue to unfold. During January’s Arctic Blast, prices at Transco Zone 6 reached a high of $97.00 per MMBtu on January 17 due to regional pipeline capacity issues, according to the EIA. Additionally, the potential for freeze-offs could constrain production and cause pipeline capacity issues over this period. Natural Gas Intelligence reports that the lack of pipeline capacity along the East Coast has already reduced the productivity of natural gas manufacturers. While there are around half a dozen projects in development, there is currently no firm capacity available for the manufacturing sector.
In its February 2025 Short-Term Energy Outlook (STEO), the EIA revised its 2025 estimate for the Henry Hub spot price upward by nearly 21 percent due to the price increase in January and the EIA’s projections for below-average storage inventories through December. Into 2026, the EIA projects an average price of $4.16 per MMBtu for the year, a 9.8 percent increase over 2025 estimates and nearly double the 2024 average.
Temperatures Fall as Winter Storms Roll into U.S.
January 2025 was the coldest January since 2014, totaling 1,043 heating degree days, 5.4 percent above from the 30-year normal. The first full week of February provided some relief from the frigid temperatures, with weather 16 percent warmer than normal. Still, temperatures were 6.5 percent colder than last year for the week ending February 8. Over this period, all regions experienced warmer temperatures than last year except New England, Middle Atlantic, East North Central, and West North Central. In all regions except New England and the Pacific, temperatures were warmer than normal.
Temperatures are cooling again into mid-February as multiple snowstorms move through large portions of the U.S. Beginning on February 11, Winter Storm Harlow swept through parts of the East South Central, South Atlantic, and Mid-Atlantic regions, dropping more than 6 inches of snow in Washington D.C. and 14.5 inches in Irongate, Virginia, according to The Weather Channel. On the tail end of Harlow, Winter Storm Iliana arrived in the Central Plains Wednesday night, moving into the Great Lakes and northern New England on Thursday morning and producing heavy snowfall. Two additional snowstorms are expected into this weekend, impacting the Western U.S., Central Plains, Midwest and Northeast.
Looking ahead to next week, the National Oceanic and Atmospheric Administration (NOAA) temperature outlook forecasts that most of the continental U.S. will experience below-normal temperatures between February 18 and 22. The West Coast, Hawaii, the Aleutian Islands, and parts of Florida and Alaska may experience above or near-normal temperatures over the same period.
Consumption Rebounds into Mid-February
For the week ending February 14, preliminary data from S&P Global Commodity Insights suggests that total domestic consumption increased by 14 percent compared to the week prior and by 21.9 percent year-over-year. Regionally over this period, total demand:
- Increased over the previous week for all regions
- Rose the most in the Rockies, Midcontinent, and Texas, increasing by 54.5 percent, 42.7 percent, and 18.6 percent, respectively.
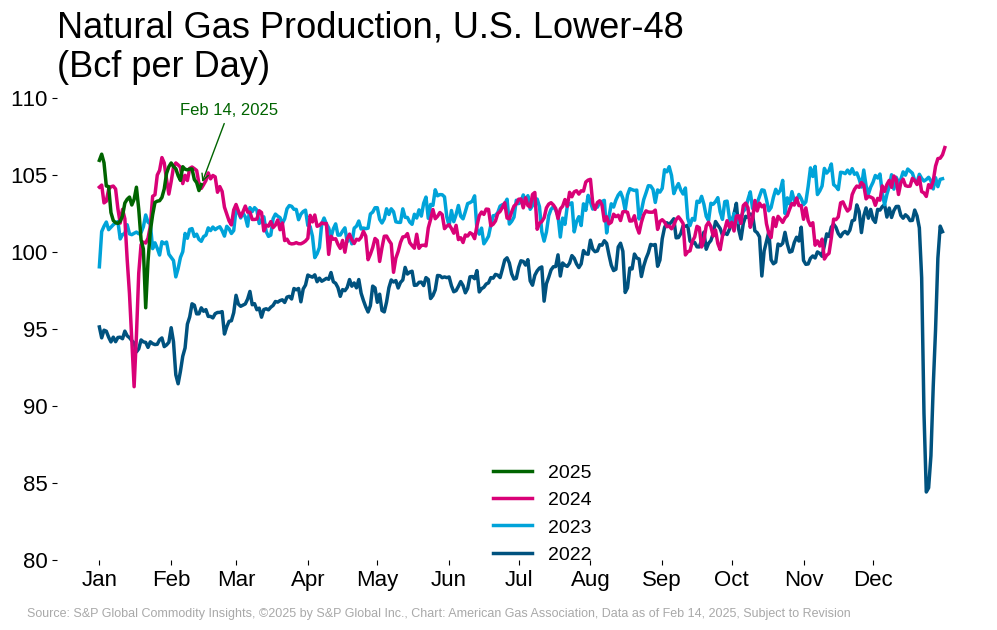
Production Returns to Year-Ago Levels
According to preliminary data from S&P Global Commodity Insights, domestic dry natural gas production for the week ending February 14 is maintaining week-over-week levels around 105 Bcf per day. Relative to the same period last year, production for the week is down 0.2 percent. Production improvements are tied to milder weather conditions following two winter storms and other winter weather impacts across the U.S. in January and a slight uptick in natural gas rig counts week-over-week in early February. Regionally for this period:
- The Southwest and Southeast regions are realizing production gains of 3.5 percent and 1.1 percent, respectively
- Production has fallen 3 percent in the Midwest and 1.4 percent in Texas
- Production in the Northeast and Rockies regions decreased by at least 0.2 percent each while Midcontinent production increased by 0.1 percent
LNG Feedgas Deliveries Increase Week-Over-Week
The EIA reports that a total of 29 LNG vessels with a combined carrying capacity of 110 Bcf departed the U.S. between January 30 and February 5. Over the same period, data from S&P Global Commodity Insights suggest that average daily LNG feedgas deliveries increased 10.7 percent compared to the previous week. Most recently, preliminary data suggests that feedgas flows are up 3.4 percent week-over-week and up 12.2 percent year-over-year for the week ending February 14. As of the time of this writing, feedgas flows may be near or at new daily record levels.
Storage Inventories Sink Lower Ahead of Continued Winter Weather
The EIA reports net withdrawals of 100 Bcf for the week ending February 7, reducing total storage inventories to 2,297 Bcf. Inventories now sit 67 Bcf below the five-year average and are 9.7 percent lower than the same period last year. All regions posted working gas storage withdrawals for the week, with the largest withdrawal of 46 Bcf occurring in the Midwest. In the Mountain and Pacific, storage inventories remain above the regional five-year average by 40.9 percent and 14.3 percent, respectively.
Canadian Imports Soar Year-Over-Year
For the week ending February 14, net imports from Canada increased 9.5 percent over last week and 30.0 percent over the same period last year, according to preliminary data from S&P Global Commodity Insights. Exports to Mexico also increased week-over-week by 6.5 percent and by 11.0 percent year-over-year. Heightened consumption levels resulting from the winter weather may be influencing demand for Canadian gas.
Natural Gas Rig Activity
Baker Hughes reports 100 natural gas rigs for the week ending February 7, a 2 percent increase from last week and a 17.4 percent decrease compared to last year. Year-over-year oil directed-rigs also declined, falling by 19 rigs or 3.8 percent.
What to Watch:
- Production: As the wintery forecast unfolds, will domestic dry gas production continue its recent rebound, or will extreme cold disrupt supply?
- Pipeline Constraints: How will the approaching winter storms impact prices and production along the East Coast amid existing regional pipeline capacity issues?
- Imports: Given the pending import tariff, how will heightened demand driven by colder temperatures impact Canadian import levels?
For questions please contact Juan Alvarado | jalvarado@aga.org, Liz Pardue | lpardue@aga.org, or
Lauren Scott | lscott@aga.org
To be added to the distribution list for this report, please notify Lucy Castaneda-Land | lcastaneda-land@aga.org
NOTICE
In issuing and making this publication available, AGA is not undertaking to render professional or other services for or on behalf of any person or entity. Nor is AGA undertaking to perform any duty owed by any person or entity to someone else. Anyone using this document should rely on his or her own independent judgment or, as appropriate, seek the advice of a competent professional in determining the exercise of reasonable care in any given circumstances. The statements in this publication are for general information and represent an unaudited compilation of statistical information that could contain coding or processing errors. AGA makes no warranties, express or implied, nor representations about the accuracy of the information in the publication or its appropriateness for any given purpose or situation. This publication shall not be construed as including advice, guidance, or recommendations to take, or not to take, any actions or decisions regarding any matter, including, without limitation, relating to investments or the purchase or sale of any securities, shares or other assets of any kind. Should you take any such action or decision; you do so at your own risk. Information on the topics covered by this publication may be available from other sources, which the user may wish to consult for additional views or information not covered by this publication.
Copyright © 2025 American Gas Association. All rights reserved.