Natural Gas Market Indicators – February 27, 2025
Natural Gas Market Summary
This winter heating season has been shaped by record gas demand, a shifting policy landscape, and evolving outlooks for future gas infrastructure requirements. The extreme cold in January triggered record storage withdrawals to meet record U.S. domestic demand. Monthly domestic gas demand reached a record in January 2025, while gas consumed for electric power reached a winter record, and industrial demand reached an all-time monthly high. Imports of gas from Canada in January were the highest since 2009, reflecting the important contribution of Canadian gas to U.S. supply stability. However, tariffs loom as the 30-day pause on Canadian and Mexican imports, including a 10 percent tariff on natural gas from Canada, comes to an end on March 4 unless further negotiations or actions alter the timeline. Amid the near-term uncertainty, energy companies continue to make announcements of large natural gas power plant projects to meet growing electricity requirements, driven in part by data centers and generating AI requirements.
Prices Boosted by Weather and Inventory Drawdowns
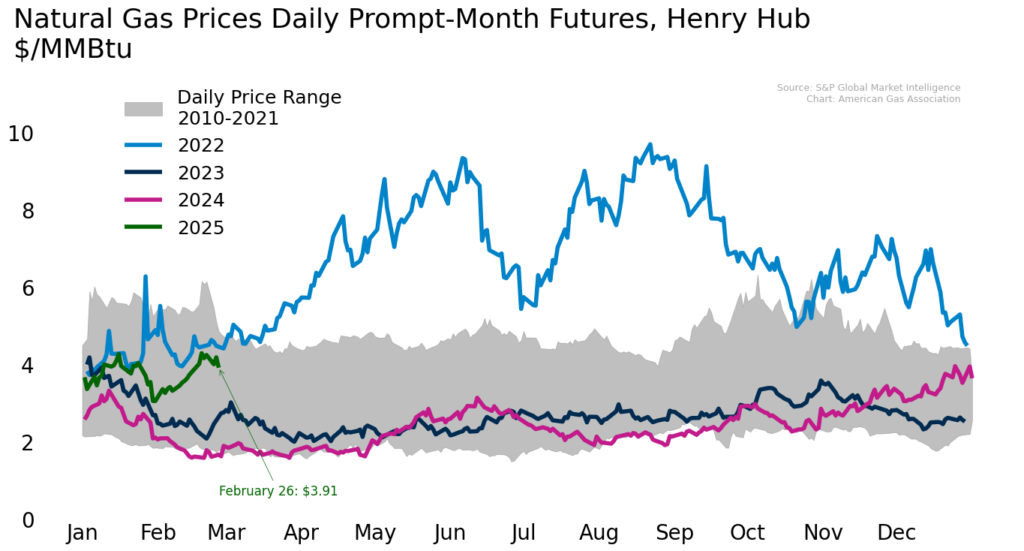
Henry Hub futures rose in February, boosted by cold weather and drawdowns in storage. March contracts are hovering around $4 per MMBtu as of February 26. Prices have some lift on the futures strip, and contracts are calling for premiums through the summer, rising to $4.83 per MMBtu by August. Currently, January 2026 contracts are calling for $5.20 per MMBtu, perhaps reflecting a perceived tighter market into next year. Rystad Energy is forecasting a Henry Hub average of $3.57 per MMBtu for 2025, which is below the $3.80 per MMBtu average Henry Hub spot price in the EIA’s February Short-Term Energy Outlook.
Of course, regional prices can tell a different story. The locations with the highest natural gas prices are those constrained by a lack of pipeline infrastructure. Transco Zone 6 NY reached $9.59 per MMBtu for the week ending February 19. The Algonquin Citygate, which serves the Boston area, and Iroquois Zone 2, which serves upstate New York, both saw spot prices near $20 per MMBtu in mid-February. As is often the case, pricing during these demand spikes signals a lack of available capacity as consumers turn to natural gas for heating and power.
A Mild Start to March
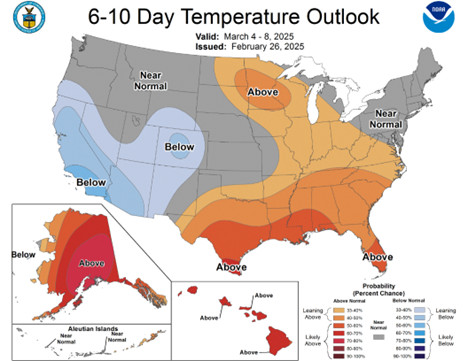
A second wave of cold weather in mid-February brought temperatures in the U.S. that were 38 percent colder than last year and 31 percent colder than usual for the week ending February 22, as measured by gas-weighted heating degree days. With the exception of the Pacific, all regions experienced both colder than normal temperatures and colder temperatures than last year. After multiple winter storms, March may come in like a lamb. The NOAA temperature outlook indicates some warmer temperature possibilities for much of the Midwest, South, and Mid-Atlantic during the first week of March, while parts of the Northeast, Midwest, and Western U.S. could see temperatures near or below normal. Parts of the Southwest and Maine could see below-normal temperatures for this period. There’s a possibility of some active weather during the first period of March, but no extreme cold on the horizon.
Demand Is Easing While Long-Term Power Requirements Appear to Grow Amid Announcements
Preliminary data from S&P Global Commodity Insights suggests total demand, including exports, increased 2.4 percent for the week ending February 24 as the effects of Winter Storm Kingston and other winter weather events subsided. Domestic consumption for the week increased by 2.2 percent, driven by a 6 percent increase relative to the prior week in the power sector. Industrial consumption increased by 1.1 percent week-over-week, while Residential/Commercial consumption increased by 0.1 percent.
In response to the escalating electricity demands driven in part by data centers and artificial intelligence (AI) applications, several major natural gas infrastructure projects have been announced recently. On February 26, NRG Energy, along with GE Vernova and Kiewit Corporation, announced its intent to construct more than 5 gigawatts of natural gas combined cycle plants beginning in 2029 through 2032. Earlier in February, CloudBurst Data Centers unveiled plans for a new data center campus in San Marcos, Texas, powered by a 1.2 GW natural gas plant, entering a supply agreement with Energy Transfer Partners for 450,000 MMBtu per day. In January, Chevron, along with GE Vernova and Engine No. 1, announced plans to develop “power foundries” that aim to deliver 4 GW of power by the end of 2027. Entergy announced in December 2024 plans to add 2.26 GW of natural gas-fired generation capacity in northern Louisana. ExxonMobil also announced in December plans for a new 1.5 GW natural gas-fired power plant to power data centers. These announcements underscore the trend of leveraging natural gas infrastructure to support growing energy requirements.
Production is Steady, and Freeze-offs Were Lessened This Year
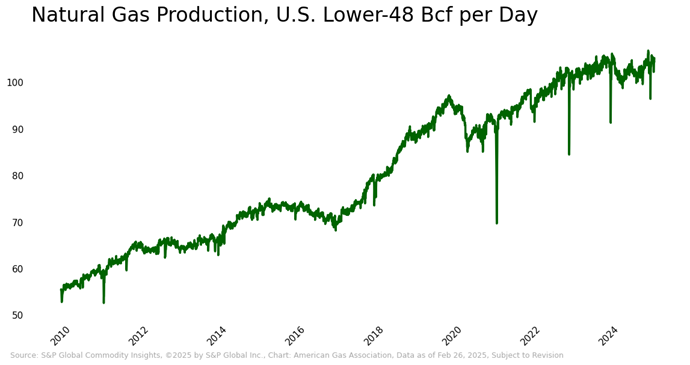
Rystad Energy reports expected U.S. dry gas production of 104.6 Bcf per day in February 2025. Daily data from S&P Global Commodity Insights suggests similar levels month to date, with an uptick in flowing gas as February comes to a close.
Notably, the depth and duration of production declines this winter were much less than during prior cold events, including in 2021 (Uri), 2022 (Elliot), and 2023 (Heather). In extreme cold, water in natural gas wells can freeze at the wellhead, causing a “freeze-off” that restricts production. In recent years, upstream and midstream operators have taken steps to invest in new technologies and operational practices to address supply disruptions during cold weather events. Additional communication and collaboration across the natural gas industry ahead of and coming out of winter have likely contributed to improved performance of dry gas flows during the coldest periods of the year.
LNG Feedgas Sets a New Daily Record
Liquefied natural gas (LNG) export activity from the U.S. has been running at record or near-record levels. Feedgas data reported from Rystad reached a new record of 16.3 Bcf per day on February 23. According to the EIA, a total of 29 LNG vessels with a combined carrying capacity of 110 Bcf departed the U.S. between February 13 and February 19. Most of these volumes are directed toward Asia and Europe, as both Dutch prices (TTF) and Asian LNG (JKM) trade around $14 per MMBtu. LNG imports into New England had been minimal (less than 0.1 Bcf) for much of February but spiked for several days and reached 0.9 Bcf on February 20 to meet cold weather demand.
Storage Inventories Have Drawn Down in Line with Five-Year Average
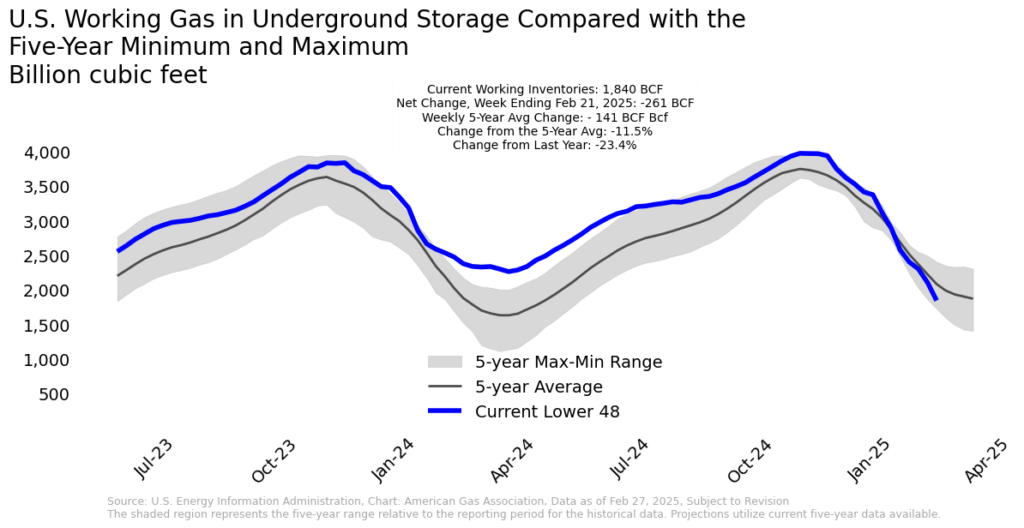
The EIA reports net withdrawals of 261 Bcf for the week ending February 21, which is 120 Bcf or 85 percent more than the five-year average withdrawal for the same week. Inventories are now 1,840 Bcf, which are 12 percent below the five-year average and 23 percent below last year. Surplus inventories carried over from last winter have been consumed, and inventories are now moving below the five-year average. Notably, the substantial storage drawdown is also taking place across the pond, as European inventories have seen their third-largest cumulative withdrawal since 2012.
Canadian Imports of Natural Gas Rise During Cold Snap
Imports of natural gas from Canada have been a vital balancing factor this winter, especially during the significant cold events. For the week ending February 24, net imports from Canada increased 11 percent over the prior week and 50 percent over the same period last year, according to preliminary data from S&P Global Commodity Insights. Severe cold in the northern U.S. contributed to a surge in Canadian imports as utilities and pipeline operators increased imports to serve Midwestern and Northeastern markets.
Over the next week, market analysts and the general public alike will be looking to see whether the U.S. administration will proceed with a 10 percent tariff on Canadian energy imports, including natural gas. The President announced this tariff in February but paused its implementation for 30 days. If the tariff goes into effect, imported costs of natural gas from Canada will likely rise in the short term, and the market may begin to adjust flows and pricing in response to the new policy.
According to the U.S. Energy Information Administration, exports to Mexico averaged about 6.4 Bcf per day in mid-February. Year-over-year growth reflects Mexico’s increasing use of gas-fired power generation, industrial demand, and new infrastructure to import more significant volumes.
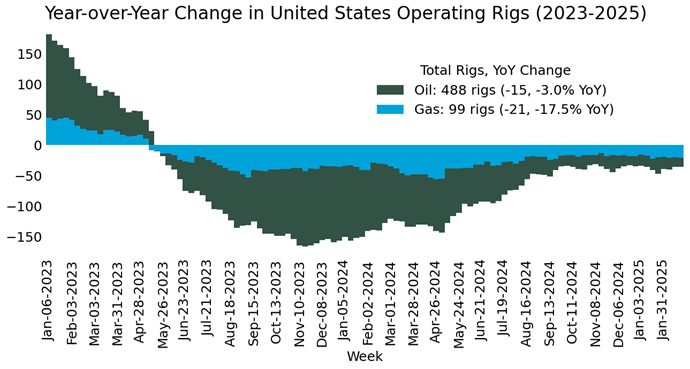
Natural Gas Rig Activity Ticks Up
The U.S. oil and gas rig drilling count has largely stabilized after the declines in 2023 and into 2024. Beginning in mid-2024, the decline in rig activity slowed, and the current count of 592 includes 99 gas rigs, 488 oil rigs (and five miscellaneous). Year on year, gas-direct rigs remain down about 18 percent, which reflects the decline in rig operations that began in late February and early March of 2024 as operators reduced activity in response to low commodity pricing. Prices have since risen, but we have not seen a commensurate increase in gas rig activity yet.
For questions please contact Juan Alvarado | jalvarado@aga.org, Liz Pardue | lpardue@aga.org, or
Lauren Scott | lscott@aga.org
To be added to the distribution list for this report, please notify Lucy Castaneda-Land | lcastaneda-land@aga.org
NOTICE
In issuing and making this publication available, AGA is not undertaking to render professional or other services for or on behalf of any person or entity. Nor is AGA undertaking to perform any duty owed by any person or entity to someone else. Anyone using this document should rely on his or her own independent judgment or, as appropriate, seek the advice of a competent professional in determining the exercise of reasonable care in any given circumstances. The statements in this publication are for general information and represent an unaudited compilation of statistical information that could contain coding or processing errors. AGA makes no warranties, express or implied, nor representations about the accuracy of the information in the publication or its appropriateness for any given purpose or situation. This publication shall not be construed as including advice, guidance, or recommendations to take, or not to take, any actions or decisions regarding any matter, including, without limitation, relating to investments or the purchase or sale of any securities, shares or other assets of any kind. Should you take any such action or decision; you do so at your own risk. Information on the topics covered by this publication may be available from other sources, which the user may wish to consult for additional views or information not covered by this publication.
Copyright © 2025 American Gas Association. All rights reserved.