Natural Gas Market Indicators – January 16, 2025
Natural Gas Market Summary
In the aftermath of Winter Storms Blair and Cora, domestic natural gas demand remains heightened, production has climbed, and Henry Hub futures and spot prices have increased. Regionally, Canadian imports have more than tripled in the Northeast, and storage inventories in the South Central region fell by 93 Bcf (36 percent of total weekly withdrawals), according to the EIA. So far, January has been the coldest since 2011, with an average departure from normal temperature of -2.4oF in the Continental U.S. as of January 15.
Amid tightening market conditions, current forecasts suggest an Arctic blast could bring severe cold across the Rockies and Texas before moving into the eastern states starting on Sunday, January 19. The National Oceanic and Atmospheric Administration (NOAA) model blend forecast shows approximately 265 million people across the lower-48 at or below freezing, and more than 60 million at or below 0°F. Extreme cold will induce greater heating and power demand, while storage will play a critical role in satisfying natural gas requirements. Depleted storage inventories may place additional upward pressure on gas prices.
Through the rest of January, consumption levels have the potential to set price trends for the year, according to the EIA’s January Short-Term Energy Outlook (STEO). The forecast now includes 2025 and 2026, anticipating that total natural gas consumption in January 2025 could average 119 Bcf per day, about the same as January 2024. By 2026, total demand is predicted to grow faster than supply, with production and imports rising by an estimated 1.4 Bcf per day while demand, including domestic consumption and exports, is expected to increase by 3.2 Bcf per day. The STEO also suggests that working gas in underground storage will fall below the five-year average late in 2025 and remain an average of 4.3 percent below the five-year average into December 2026. However, this forecast is caveated by the weather this winter. If low temperatures persist, gas inventories may fall even lower, increasing natural gas prices.
The Market Indicators team extends its gratitude to the first responders tirelessly working to combat the wildfires in Los Angeles and bring people to safety. Our thoughts are with all those affected by these devastating events.
NOAA Blend of Models Daily Low Temperature (°F) Forecast for January 20, 2025.
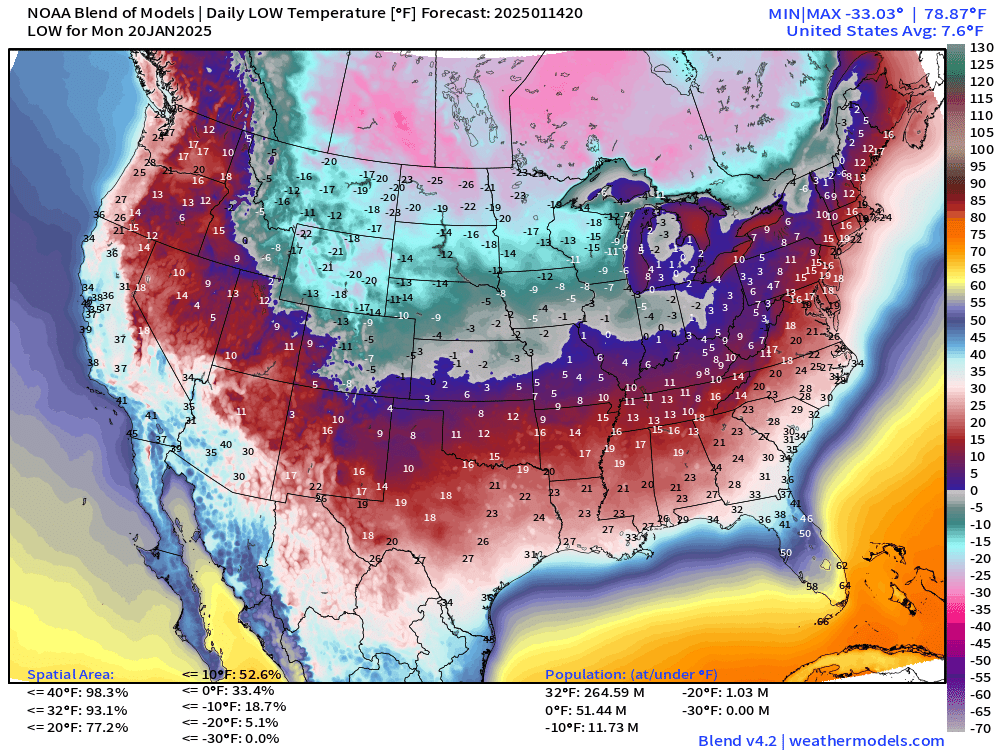
Source: Weather Trader
Prices on the Rise
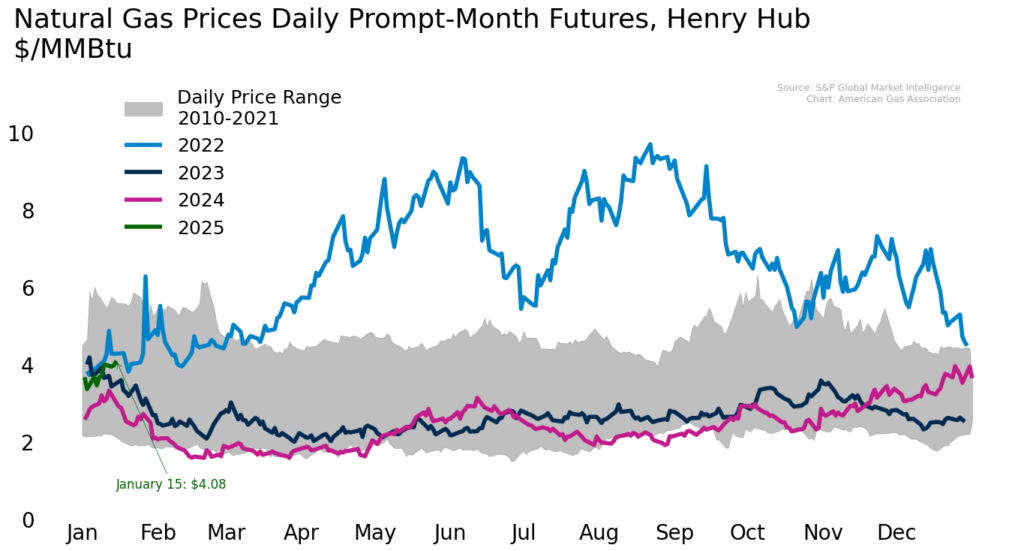
According to CME, February 2025 Henry Hub futures traded at or around $4 per MMBtu during the second week of January. On January 15, prompt month futures settled at $4.08 per MMBtu, the first time that prompt month prices have exceeded $4 in two years. Contracts further show a decline in pricing, dropping to $3.44 and $3.40 for March and April, respectively. The market will continue to adjust as the extent and severity of the upcoming cold event becomes clearer.
Regionally, the EIA reports spot price increases at all major pricing locations for the week ending January 8 as cold weather and winter storms impacted the U.S.
- At Algonquin Citygate, prices rose $11.69, or 240.5 percent, from $4.86 per MMBtu on January 1, to $16.55 per MMBtu on January 9
- At Transco Zone 6 NY, prices also surged, rising $8.13, or 241.2 percent
- Prices at Eastern Gas South, PG&E Citygate, Northwest Sumas, and Houston Ship Channel rose $0.29, $0.50, $0.58, and $0.92, respectively.
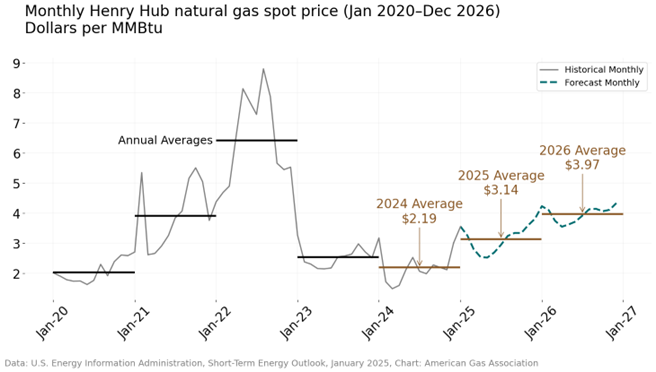
The January 2025 STEO indicates a tighter market, contributing to a relatively modest increase in natural gas prices through 2026. The STEO expects Henry Hub spot prices to rise to $3.14 per MMBtu in 2025 and $3.97 per MMBtu in 2026. Prices between $3 and $4 align with historical trends over the last decade
More Winter Weather on the Horizonild Holiday Season in Store for Much of the U.S.
After a warmer-than-normal December, January began with colder temperatures across much of the U.S. as Winter Storms Blair and Cora brought snow and ice to states from coast to coast. For the week ending January 11, weather in the U.S. was 19.6 percent colder than last year and 8 percent colder than the 30-year normal, with all regions but the Mountain and Pacific regions experiencing colder temperatures year-over-year. Despite being 10 percent warmer than the 30-year normal, the U.S. was 12.6 percent colder than last year in December 2024.
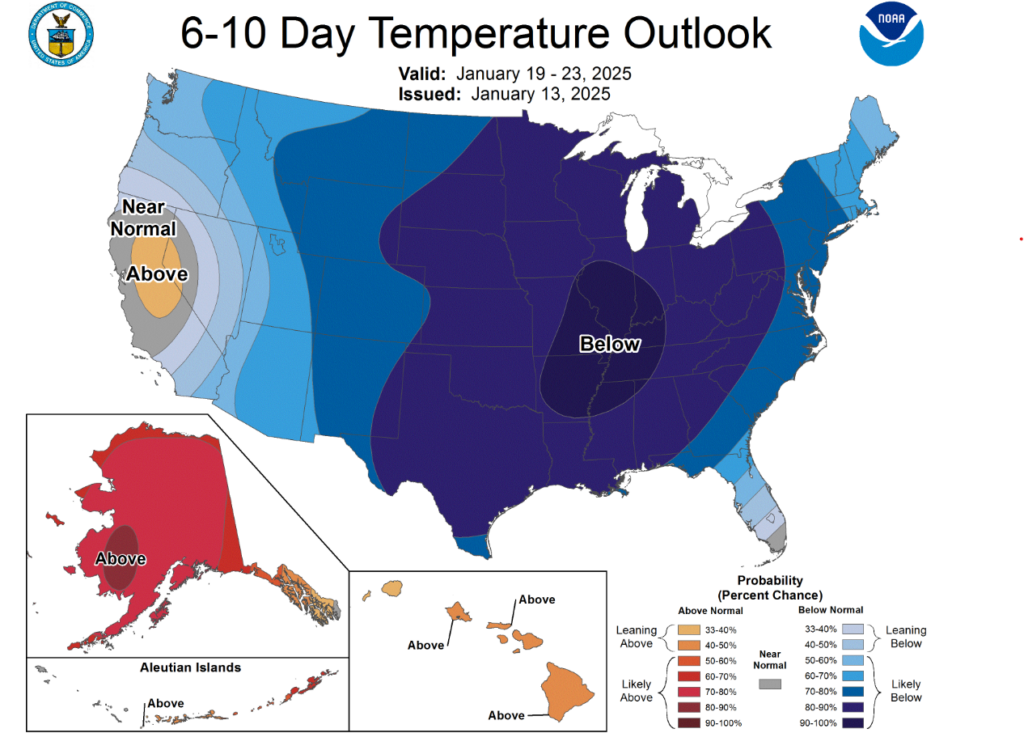
According to NOAA, the anticipated La Niña weather pattern has arrived. La Niña is expected to influence winter weather for the remainder of the winter heating season, contributing to below-average temperatures for northern and midwestern states. While The Weather Channel categorizes the current La Niña as “weak” and notes it may “exert less influence on temperatures and precipitation,” the continental U.S. has experienced the weather patterns typical of La Niña so far this season. Specifically, the northern U.S. has experienced cooler and wetter weather, while the southern U.S. has been warmer and drier. In the near term, the NOAA predicts below-average temperatures from January 19 to 23 for most of the continental U.S. Meanwhile, Hawaii, the Aleutian Islands, and most of Alaska are expected to have above-normal temperatures during this period. The National Weather Service issued a forecast on January 13 advising of Artic air moving southeast from the upper Midwest this week, contributing to lower temperatures and expected to cause heavy lake effect snow showers in northern states.
The colder temperatures could bring a mix of weather, including snow. Through January 27, Weather Trader’s median outcome for snowfall suggests that there may be snowfall across the upper northern half of the U.S. Snowfall could exceed 10 inches in states such as Michigan. Pennsylvania, and New York, but does not yet signal for a Nor’easter storm system. However, excess snowfall and La Niña conditions may still contribute to further market tightening, necessitating storage drawdowns, threatening already flagging production, and placing upward pressure on prices.
Cold Weather Boosts Demand
According to the EIA, domestic natural gas consumption rose by 32 percent (28.1 Bcf per day) for the week ending January 8. This increase was largely driven by a 60.2 percent (19.8 Bcf per day) increase in the residential/commercial sector and a 20.4 percent (6.2 Bcf per day) increase in the power sector. Industrial sector demand increased by 9 percent (2.2 Bcf per day) week-over-week.
Compared to the same period last year:
- Residential and commercial sector demand is up more than 17 percent
- Power sector demand is up more than 2 percent
- Industrial sector demand is up just over 5 percent
Natural Gas Production Lag Continues
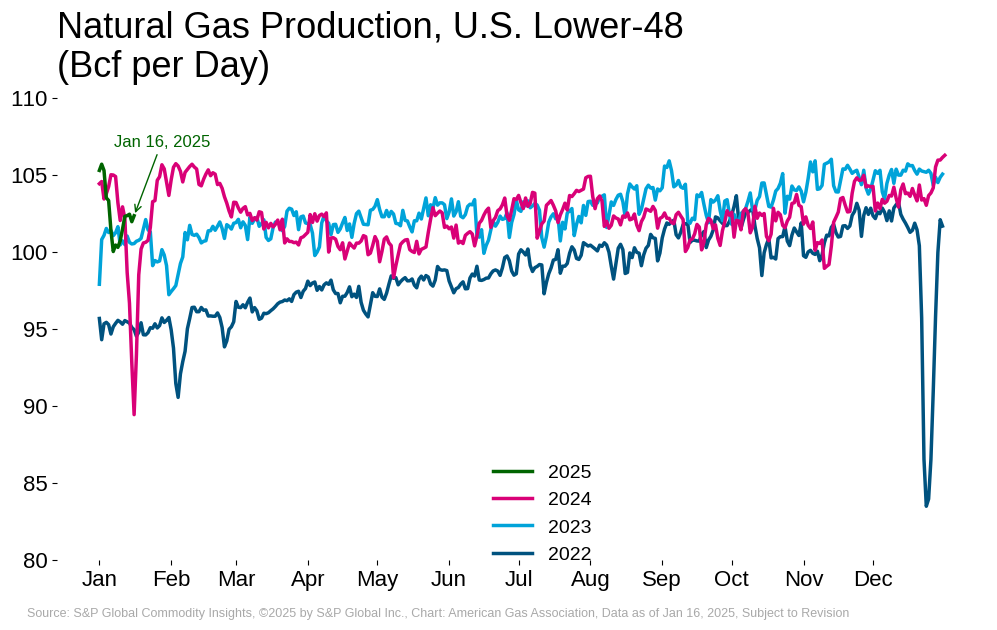
According to the EIA, dry natural gas production fell by 2.2 percent (2.3 Bcf per day) for the week ending January 8, due in part to compromised pipeline conditions such as well-head freeze-offs as reported by S&P PointLogic Insight. Compared to the same period last year, dry natural gas production was down 0.6 percent (0.6 Bcf per day).
According to data from S&P Global Commodity Insights:
- Year-over-year production fell 1 percent in December 2024
- January month-to-date production is up nearly 1 percent relative to the same period last year as of January 16
Plaquemines Begins Shipments, LNG Exports Continue Growth
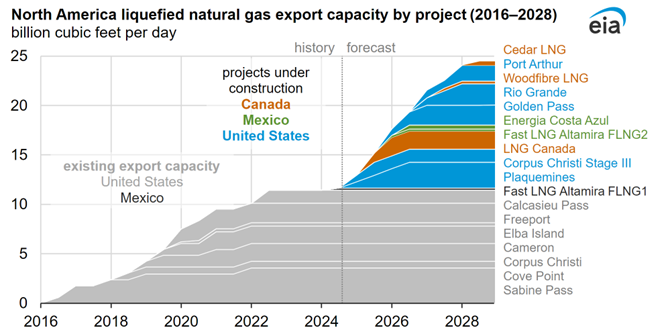
A total of 27 LNG vessels with a combined carrying capacity of 102 Bcf departed the U.S. between January 2 and 8, according to the EIA. Nine of the vessels departed from Sabine Pass, five from Corpus Christi, four from Cameron, four from Freeport, three from Calcasieu Pass, one from Cove Point, and one from Plaquemines Phase 1. Plaquemines, the eighth LNG export terminal to open in the U.S., shipped its first cargo on December 26, 2024. After Phase 2 is completed (estimated date is September 2025), the total nominal capacity of the facility will be 2.6 Bcf per day. The EIA estimates that after Plaquemines Phase 2 and Corpus Christi LNG Stage 3 are operating at full capacity, total nominal LNG production capacity in the U.S. will increase to 15.4 Bcf per day. Into 2028, EIA estimates Plaquemines Phase 2, Corpus Christi Stage 3, and eight other projects will expand North American export capacity by 13 Bcf per day, from 11.4 Bcf per day in 2023 to 24.4 Bcf per day in 2028, an increase of 114.0 percent.
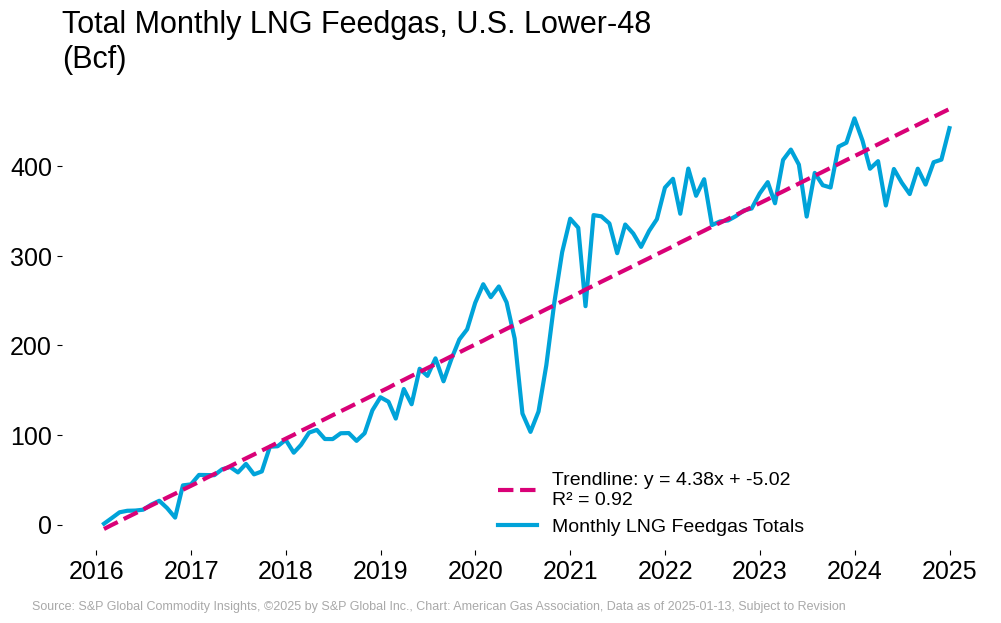
From the December opening of Plaquemines Phase 1 to January 13, 2025, average LNG feedgas to export terminals has increased by 1.4 percent, compared to the same period a year prior, according to data from S&P Global Commodity Insights. Additional data indicate:
- In 2024, total LNG feedgas to terminals increased 0.1 percent over 2023 levels
- For the week ending January 16, LNG feedgas increased 14.7 percent over the same week last year and increased 2.0 percent over last week
Largest Storage Withdrawal so Far in the Winter Season
The EIA reports net storage withdrawals of 258 Bcf for the week ending January 10, a 7.6 percent week-over-week decline in working gas in underground storage. This is the largest withdrawal to date in the 2024-2025 winter heating season. Inventories now sit at 3,115 Bcf, which is 3.4 percent below last year but 2.5 percent higher than the five-year average. The largest week-over-week withdrawal occurred in the South Central region (93 Bcf or 7.7 percent).
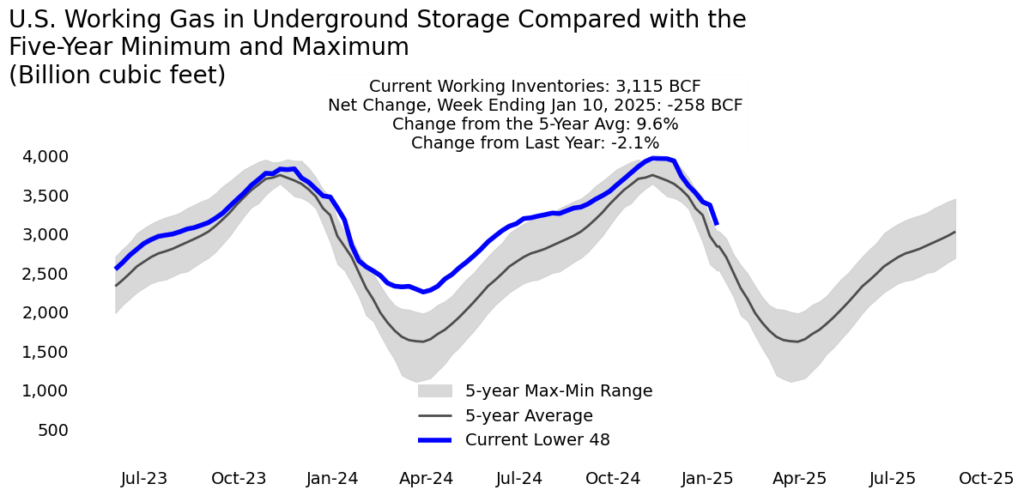
In its December 2024 forecast, Rystad Energy projects working gas in underground storage to be approximately 2,600 Bcf at the end of January, down 23.5 percent compared to the actual storage level reported by the EIA for the week ending December 27.
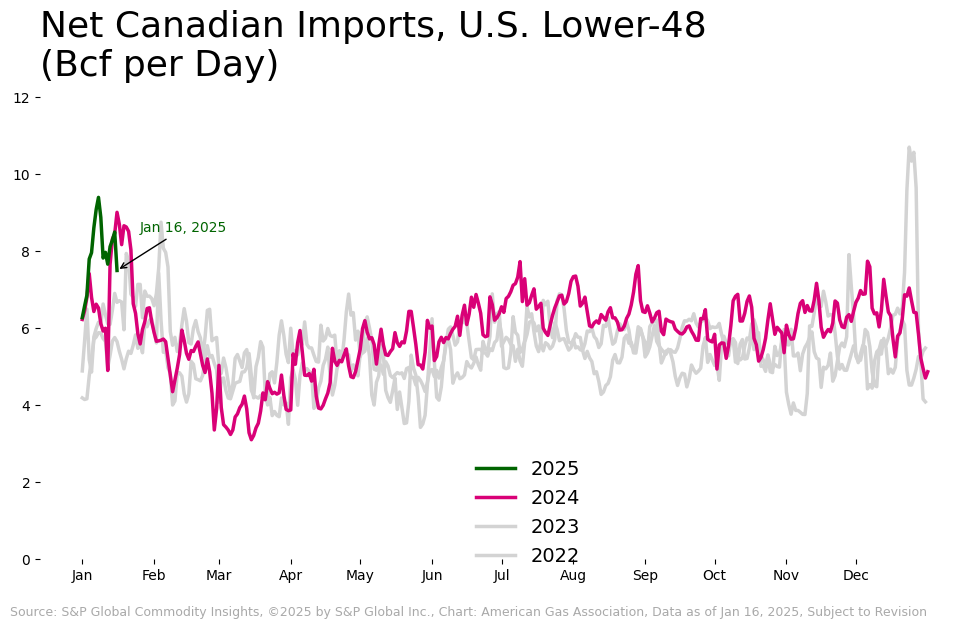
Canadian Imports Spike in Response to Winter Demand
According to data from S&P Global Commodity Insights, net Canadian imports decreased 4.7 percent from last week for the week ending January 16. Net exports to Mexico increased by 3.11 percent for the same week.
Year-over-year in the lower-48:
- Canadian imports are up 11.1 percent
- Exports to Mexico are 10.3 percent higher
For the month of January, net Canadian imports are up 16 percent from last year. Heightened imports coincide with back-to-back Winter Storms Blair and Cora and colder-than-normal temperatures, increasing domestic demand and reducing regional production. In the Northeast, data from S&P Global Commodity Insights indicates that Appalachian production fell 3 percent during the colder weather, tripling Canadian imports to 1.2 Bcf per day, as reported by the EIA.
Natural Gas Rig Activity Sees Slight Decline
Baker Hughes reports 100 natural gas rigs for the week ending January 10, a 2.9 percent decrease from last week and a 14.5 percent decline compared to last year. Oil-directed rigs decreased year-over-year by 3.8 percent.
What to Watch:
- Weather: With demand already heightened and softening production, will the cold winter forecast increase market tightening?
- LNG: U.S. export capacity continues to expand. How will heightened gas demand impact feedgas flows and cargo shipments?
- Storage: Will persistent cold weather push storage inventories below the five-year average?
For questions please contact Juan Alvarado | jalvarado@aga.org, Liz Pardue | lpardue@aga.org, or Lauren Scott | lscott@aga.org
To be added to the distribution list for this report, please notify Lucy Castaneda-Land | lcastaneda-land@aga.org
NOTICE
In issuing and making this publication available, AGA is not undertaking to render professional or other services for or on behalf of any person or entity. Nor is AGA undertaking to perform any duty owed by any person or entity to someone else. Anyone using this document should rely on his or her own independent judgment or, as appropriate, seek the advice of a competent professional in determining the exercise of reasonable care in any given circumstances. The statements in this publication are for general information and represent an unaudited compilation of statistical information that could contain coding or processing errors. AGA makes no warranties, express or implied, nor representations about the accuracy of the information in the publication or its appropriateness for any given purpose or situation. This publication shall not be construed as including advice, guidance, or recommendations to take, or not to take, any actions or decisions regarding any matter, including, without limitation, relating to investments or the purchase or sale of any securities, shares or other assets of any kind. Should you take any such action or decision; you do so at your own risk. Information on the topics covered by this publication may be available from other sources, which the user may wish to consult for additional views or information not covered by this publication.
Copyright © 2025 American Gas Association. All rights reserved.