Natural Gas Market Indicators – July 11, 2024
Natural Gas Market Summary
The natural gas market is feeling the heat this summer, driven by extreme weather and the onset of hurricane season. Heat waves continue to sweep the nation, breaking long-standing temperature records and leading to surging electricity demand. From June 15 to 26, the Pennsylvania-New Jersey-Maryland Interconnection (PJM) experienced peak daily demand between 1 to 24 percent more than the maximum of any June day in the past 5 years, according to the EIA. In the Atlantic, Hurricane Beryl also broke records: the earliest Category 5 hurricane in the Atlantic and strongest winds recorded in July. Touching down in Texas as a Category 1, Tropical Strom Beryl caused extreme weather in the Mid-West, Great Lakes, and East.
Beyond extreme weather events, the U.S. LNG market will continue its growth as FERC approves Venture Global’s LNG export facility, CP2, in Louisiana. However, final approval is still on hold given the Biden Administration’s pause on new LNG export terminal approvals. CP2, if completed, will be the nation’s largest export facility. At peak capacity, CP2 will be capable of exporting 24 million metric tons per year contributing to the United States’ global domination in LNG exports, according to PoliticoPro
Reported Prices
August contract trading has officially opened at Henry Hub. Prices are $2.29 per MMBtu as of July 11, as reported by CME. Futures prices are expected to increase through the winter, peaking at $3.60 per MMBtu in January.
In the spot market, Henry Hub prices for the beginning of July have decreased from those seen in late June, from an average price of $2.52 per MMBtu the week ending June 28 to $2.06 per MMBtu as reported for July 2, according to the EIA. In the wholesale power market, ERCOT North Hub prices increased 64 percent to a month high of $55 per MWh on June 26 according to Reuters. This was a $21 per MWh increase in spot price from the June average of $34. This is likely due to the increased demand in Texas, which includes the ERCOT North Hub, due to increased temperatures, extreme weather, and the growing number of data centers.
Weather
For the week ending July 6, temperatures were 3.7 percent cooler than last year but 17.9 percent warmer than the 30-year normal as measured by cooling degree days. Regionally, the East North Central region saw the largest increase in cooling when compared to last year, with 40.8 percent fewer cooling degree days. The Pacific has the largest spike in warmth, with 29.6 percent more cooling degree days than last year.
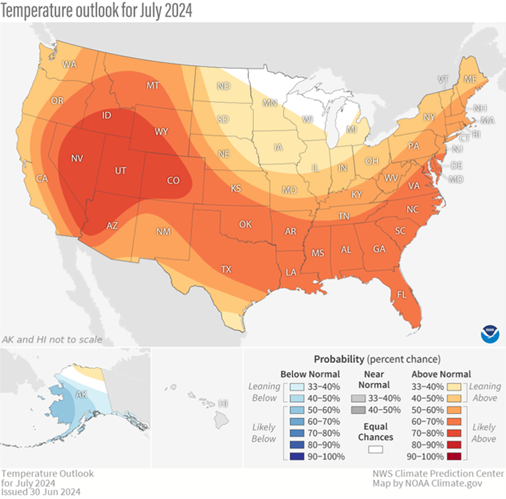
According to the EIA, the heatwave that swept the nation in June set more temperature records. Between June 19 and June 24, over 20 heat records were broken across Maine, Philadelphia, South Jersey, Deleware, and Washington D.C. Temperatures across the United States are expected to remain well above average, especially in Texas where daily highs are predicted to reamin the the mid 90s for the remainer of July and August, according to NOAA’s Climate Prediction Center’s monthly outlook for July. In large parts of the Western, Southern, and Eastern parts of the country the odds of heat continuing are over 60 percent, and in the Great Basin and parts of the Southwest and Intermountain West the odds are over 70 percent.
Hurricane season has officially begun, with the first storm touching down in the U.S. on the morning of July 8, according to NOAA. Hurricane Beryl made landfall near Matagorda, Texas as a Category 1 hurricane with 80 mile per hour winds on July 8, and continued along the coast of Texas from Port O’Connor to the Sabine Pass as a tropical storm. As Beryl continued to move through the U.S., it caused strong winds, flooding, storm surge, and tornadoes in the Midwest, Great Lakes, and East through Thursday, according to The Weather Channel. Before Beryl made landfall in Texas, it landed in on the Grenadan island of Carriacou on July 1. At this stage, Beryl was a Category 4 hurricane with maximum sustained winds of 150 miles per hour. The hurricane broke numerous records, including the earliest Category 5 hurricane in the Atlantic Basin and the strongest July hurricane by wind speed in the Altantic with winds at 165 miles per hour, according to The Weather Channel. Beryl set the precedent for this upcoming hurricane season by breaking records set in 1993 and 2005, two of the busiest Atlantic hurricane seasons on record, as reported by Reuters. The season’s intensity is magnified by warmer ocean tempertatures. There are no other hurricanes reported in the Central Pacific, Eastern Pacific, or the Atlantic.

Demand
As reported by the EIA, total U.S. consumption rose by 5.7%, or 4.1 Bcf per day week over week, from an average of 71.9 to 76.0 Bcf per day for the week ending June 26. Compared to the same week last year, this is a 7.8 percent increase. Growth is most evident in power demand, with averages increasing from 40.9 to 45.3 Bcf per day week-over-week, a 10.8 percent increase. Contrastingly, industrial and residential/commercial demand fell from averages of 21.4 to 21.3 Bcf per day and 9.7 to 9.5 Bcf per day week-over-week.
U.S. heatwaves continue to influence power demand. According to the EIA, June heatwaves increased electricity demand in the eastern and midwestern United States. On June 21, demand across the Eastern Connection, which covers most the U.S. mainland east of the Rocky Mountains except Texas, peaked at 502,670 megawatts in 1 hour, a 7.5 percent increase from the hourly June peak of 467,609 megawatts in 2023. On the same day, PJM, a regional transmission organization within the Eastern Connection, peaked at 147,976 megawatts, a 19 percent increase from June hourly peak demand in 2023. During the heatwave, PJM experienced peak daily demand between 1 to 24 percent more than the maximum of any June day in the past 5 years, according to EIA.
Another emerging influence on power demand is the growth of artificial intelligence and data centers. According to an article published on Bloomberg, Google has seen a 48 percent increase in emissions due to higher energy use associated with AI. The rapid growth of technology requires an increasing number of data centers and energy to run AI systems, thus surging power demand in the area. Similarly, the EIA reports that electricity consumption in the U.S. commercial sector has recovered from pandemic levels due to the concentrated growth of large-scale computing facilities in certain states. Virigina has seen the most growth, adding 14 billion kilowatt-hours to electricity demand. The state has become a major hub for data centers, adding 94 new facilities since 2019.
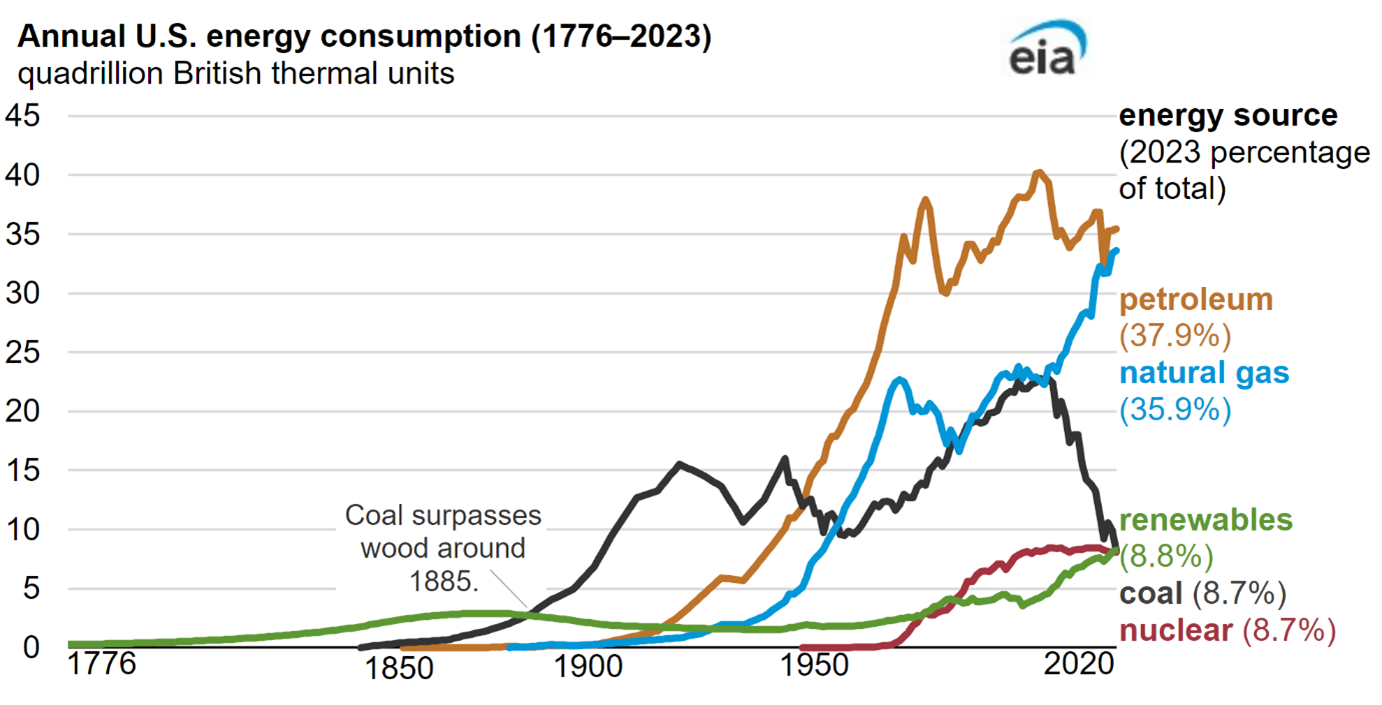
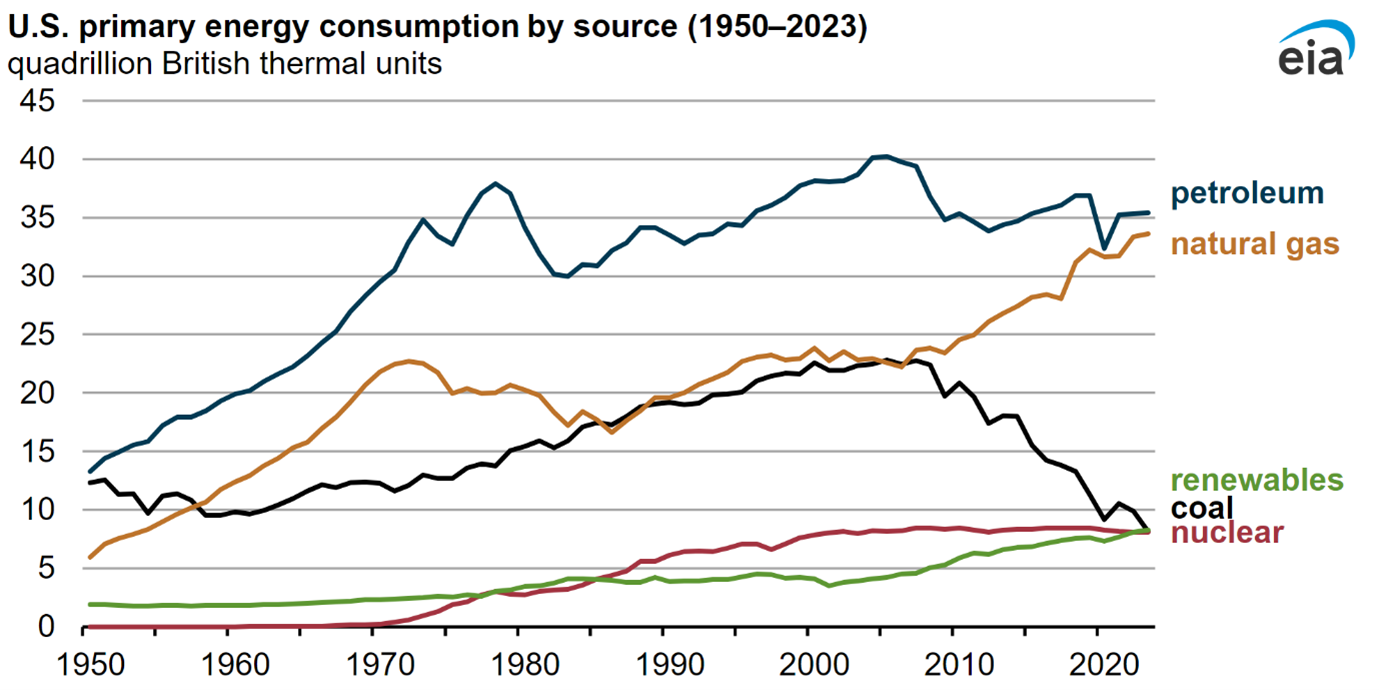
Hurricane Beryl impacted demand in Texas on Monday afternoon, as reported by Reuters. Over 2.7 million homes and businesses were without power, and CenterPoint Energy, which provides power to the southern and eastern parts of the state, warned that outages for 2.2 million customers may last for several days. On a broader scale, natural gas continues as a leader of U.S. energy consumption, making up more than a third of total consumption in 2023 according to the EIA. In the same year, natural gas accounted for 42 percent of electric power consumption, beating out both coal and nuclear energy who produced 23 and 25 percent respectively.
Production
The EIA reports 100.7 Bcf per day in production for the week ending June 26, a 0.3 Bcf per day increase from last week’s production of 100.4 Bcf per day. However, compared to the same week last year there was a 1.1 percent decrease in production. Shell and Chevron reported that they have paused some offshore production and evacuated personnel in the Gulf of Mexico due to Beryl. In Texas, Hurricane Beryl paused some offshore production for Shell and Chevron, as they evacuated personnel according to Reuters. The storm, however, narrowly passed between two major production hubs in Corpus Christi and Houston, minimizing impact on regional supply disruptions.
Overall, energy production in the United States exceeded consumption by a record amount in 2023. The EIA reports that production surpassed consumption by 9 quadrillion British thermal units, or quads, last year. This increase in supply was largely driven by growth in natural gas and crude oil production. For natural gas, dry production grew 4 percent to a record 39 quads. This is a growth rate of 58 percent since 2013.
LNG Markets
Natural gas deliveries to U.S. LNG export terminals decreased 0.4 Bcf per day from 12.6 Bcf per day to 12.2 Bcf per day for the week ending June 26, according to the EIA’s Natural Gas Weekly Report. Twenty-nine LNG vessels with a combined carrying capacity of 105 Bcf departed from the U.S. between June 20 and June 26.
The ship channel leading to Corpus Christi, an LNG export terminal in Texas, reopened on Monday with no significant impact from Hurricane Beryl. Port of Houston operations are scheduled to re-open this week after impact assessments from the storms, as reported by Reuters. The port closure resulted in minor congestion of stranded vessels but is not predicted to have an impact on weekly trade flows.
According to PoliticoPro, the Federal Energy Regulatory Commission approved Venture Global’s new LNG export facility, CP2. The facility is in Cameron Parish, Louisiana, and at peak capacity can export 24 million metric tons annually. This capacity level would make it the largest LNG export terminal in the U.S., adding to the United States LNG export capacity that named it the world’s largest exporter in 2023. The approval of CP2 came after a Louisiana judge sided with 16 red states to put a pause on Biden’s block of new LNG export permits. While CP2 is approved, the Golden Pass LNG project in Texas is still delayed due to construction issues and is now scheduled to be completed in September 2025.
Working Gas in Underground Storage
According to the EIA’s Natural Gas Storage Dashboard, there was a 32 Bcf increase in working gas volumes in underground storage for the week ending June 28, bringing total inventories to 3,134 Bcf. The reported underground storage levels are 275 Bcf higher than this week last year and a 496 Bcf, or 18.8 percent increase year-over-year. The end-of-summer 2024 gas storage forecast is 3,937 Bcf while the end-of-winter forecast is 1,7141 Bcf, according to EIA.
Pipeline Imports and Exports
For the week ending June 26, the EIA reports imports from Canada decreased 4.9 percent, or 0.3 Bcf per day from the previous week. Exports to Mexico decreased 3.5 percent, or 0.2 Bcf per day for the same week.
Rig Count
Baker Hughes reports 585 rigs in the U.S. for the week ending July 5, a week-over-week increase of 4 rigs. The current oil rig count is 479, having a year-over-year decline of 61 rigs. The gas rig count is 101, an increase of 4 from last week, but a year-over-year decline of 34.
For questions please contact Juan Alvarado | jalvarado@aga.org or Morgan Hoy | mhoy@aga.org
To be added to the distribution list for this report, please notify Lucy Castaneda-Land | lcastaneda-land@aga.org
NOTICE
In issuing and making this publication available, AGA is not undertaking to render professional or other services for or on behalf of any person or entity. Nor is AGA undertaking to perform any duty owed by any person or entity to someone else. Anyone using this document should rely on his or her own independent judgment or, as appropriate, seek the advice of a competent professional in determining the exercise of reasonable care in any given circumstances. The statements in this publication are for general information and represent an unaudited compilation of statistical information that could contain coding or processing errors. AGA makes no warranties, express or implied, nor representations about the accuracy of the information in the publication or its appropriateness for any given purpose or situation. This publication shall not be construed as including, advice, guidance, or recommendations to take, or not to take, any actions or decisions regarding any matter, including without limitation relating to investments or the purchase or sale of any securities, shares or other assets of any kind. Should you take any such action or decision; you do so at your own risk. Information on the topics covered by this publication may be available from other sources, which the user may wish to consult for additional views or information not covered by this publication.
Copyright © 2024 American Gas Association. All rights reserved.