Natural Gas Market Indicators – July 29, 2024
Natural Gas Market Summary
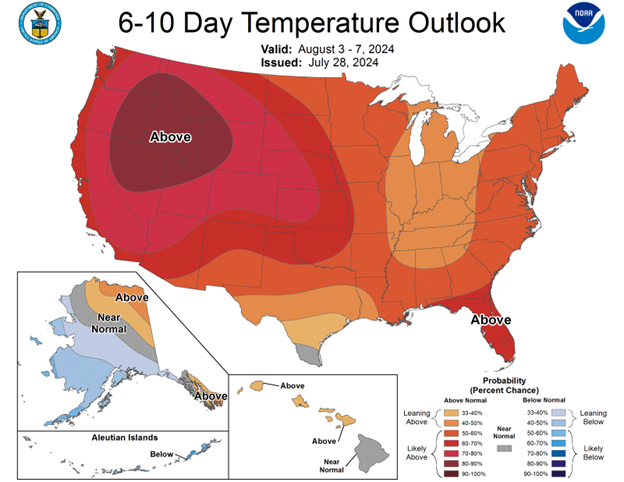
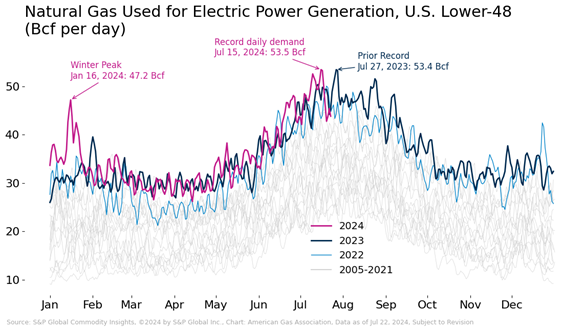
Last week, the natural gas market experienced a dramatic surge in power demand driven by record-breaking heatwaves. The extreme temperatures, particularly in the Mid-Atlantic where D.C. hit 104 degrees, led to unprecedented natural gas consumption for electricity generation, setting a new daily record of 53.5 Bcf on July 15. Global temperatures also hit record highs, with July 21 being the hottest day on record since 1940. Weather patterns will continue to influence the market, with the heat dome shifting westward, leading to cooler temperatures in the Southern Plains and Northwestern U.S. but highs in the 100s in the western U.S as reported by NOAA.
The International Energy Agency’s third quarter Gas Market Report released on July 17 highlights the recent rise of RNG production. The Report states that U.S. RNG production increased by 20% in the first half of 2024, maintaining the country’s position as a global leader in this sector. Meanwhile, it noted that global LNG supply growth has been modest, with a 2% increase year-over-year in the first half of 2024, but production is expected to recover in the latter half of the year with LNG terminal expansions and openings.
Reported Prices
As of July 22, Henry Hub prices are $2.03 per MMBtu, a 0.88 percent decrease from the prior settlement, according to CME. For the week ending on July 17, prices dipped to $1.98 per MMBtu from $2.37 per MMBtu. The EIA reports that this is the first time in July that the price was below $2.00 per MMBtu since 2020 during COVID-19. Prices increased into the next week, being $2.13 per MMBtu for July 23.
Looking at Henry Hub prices for this year, monthly averages fell by 20% to $2.56 per MMBtu between January and June of 2024, as reported by data from Refinitiv Eikon. January prices averaged $3.18 per MMBtu, dropping to $1.49 per MMBtu in March, marking the lowest average monthly inflation-adjusted price since at least 1997.
Regionally, Northwest Gas Association’s Regional Gas Outlook for July reported that Alberta Energy Company Hub prices are forecasted to stay under $4.00 per MMBtu through 2050. Additionally, Henry Hub prices are anticipated to increase to just above $4.00 per MMBtu into 2040 before dropping slightly into 2050. Comparatively, the decadal average prices were $ 3.87 per MMBtu for 1990 to 2000, $8.35 per MMBtu for 2000 to 2010, and $3.73 per MMBtu for 2010 to 2020.
Weather
For the week ending July 27, temperatures were 14 percent cooler than last year and 1.3 percent cooler than the 30-year normal, as measured by cooling degree days. Regionally for the week, all areas were cooler than normal, with West South Central experiencing the largest deviation from last year, being 30.2 percent cooler.
The heat dome settled across the U.S. in late June and early July hit record temperatures in the Mid-Atlantic on July 15. According to the Washington Post, starting July 14 the District of Columbia surpassed the century mark for record high temperatures for 3 consecutive days, matching the record set in 1930 during the Dust Bowl. On July 15, D.C. reached a peak of 104 degrees, matching the previous record date set in 1988.
Global records were also broken, with July 21 breaking last July’s record of the hottest day around the world since records began in 1940, according to Reuters. Global surface air temperature reached 62.76 degrees Fahrenheit amid heatwaves in the U.S., Europe, and Russia.
AccuWeather reports that the U.S. heat dome, peaking on July 15, waned some as its core shifted West. According to NOAA, temperatures are expected to increase in the South and Central regions during the week of July 29. Heat in the South, Midwest, and West are expected to reach dangerous levels throughout the week of July 29, with over 30 million people currently under heat advisories or excessive heat warnings, as reported by NOAA.
Last week over the Southern Plains, temperatures were cooler than normal, creating a bullseye of cooler temperatures in the Southern and Northwestern U.S. According to The Weather Channel, these cooler temperatures allowed for a dip in temperatures, with highs in the 80s being more common than the 90s in the South last week.
As of July 29, there are two disturbances in the Eastern Pacific, one having a zero percent chance of developing into a cyclone within the next 48 hours, and the other having a 30 percent chance. The latter storm off the southern coast of Mexico is expected to develop into a tropical storm in the middle part of the week, while remaining offshore.
Demand
According to the EIA, total U.S. consumption rose by 1.6 percent for the week ending on July 17. This is an increase of 1.2 Bcf per day week-over-week from an average of 77.1 Bcf per day to 78.3 Bcf per day and a 0.6 percent increase from last year.
Amid the intense U.S. heatwave, natural gas demand for electric power generation set a daily record of 53.5 Bcf on July 15, according to data from S&P Global Commodity Insights. This daily record exceeds the prior all-time high set in July of 2024. Several regional records were set as well. In the Northeast, Midcontinent, and Midwest daily highs were reached for power generation gas demand.
The use of natural gas for electricity generation in the U.S. continues to rise, driven by more renewables, retiring coal plants, and growing electric demand. Natural gas increasingly balances the intermittent nature of wind and solar power, while coal-fired generation has been declining due to plant retirements and reduced competitiveness.
Production
For the same week, there was 108.4 Bcf per day in production, a 0.4 Bcf per day decrease from last week’s production of 108.8 Bcf per day. Compared to this week last year, production increased by 0.8 Bcf per day.
U.S. natural gas dry production decreased year-over-year in the first half of 2024, starting in mid-January, due to a temporary decline in mid-January due to Winter Storm Heather, followed by persistently low prices, as reported by EIA’s Today in Energy. Production reached a low in April at 101.6 Bcf per day, which was the lowest reported daily production since December 2022.
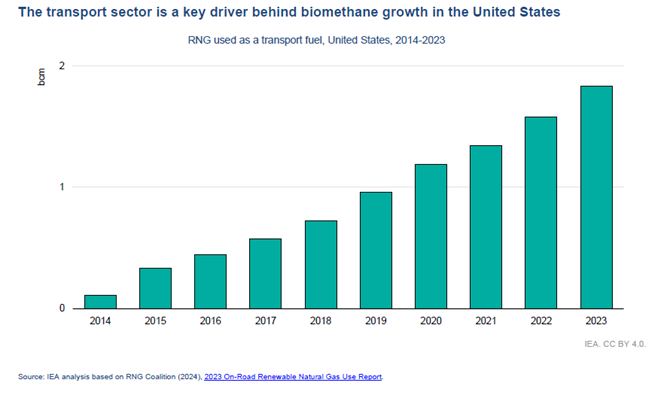
The International Energy Agency’s (IEA) Gas Market Report forecasts that the supply of low-emission gases will more than double by 2021. Europe and North America are expected to contribute to 70 percent of overall growth in both biomethane (renewable natural gas) and low-emission hydrogen. Since 2019, the U.S. has been the world’s largest RNG producer. The IEA reports that biomethane output has more than doubled since 2019, rising to over 2.5 bcm in 2023. In the first five months of 2024, this growth continued, with RNG production rising by 20% when compared to the same period last year. The transport sector is the single most important driver behind the rapid growth of biomethane. Between 2019 and 2023, U.S. transportation system increased RNG usage by 92%.
LNG Markets
For the week ending on July 17, natural gas deliveries to U.S. LNG export terminals decreased by 0.8 Bcf per day, dipping from 11.9 to 11.1 Bcf per day according to the EIA’s Natural Gas Weekly Report. Twenty LNG vessels with a combined carrying capacity of 75 Bcf departed from the U.S. between Jully 11 and July 17.
In the U.S., Freeport LNG has resumed operations after Hurricane Beryl forced operational shut down, according to an article posted to OilPrice.com. The aftermath of Beryl is said to have cancelled at least 1o cargos from the export facility. In Europe, the supply disruptions from Freeport LNG and heatwaves across the county pushed up European Natural gas prices. The week of July 22, the Axios II LNG vessel arrived at Freeport, indicating the restart of U.S. export plant operations and deescalating European gas prices to a weekly low.
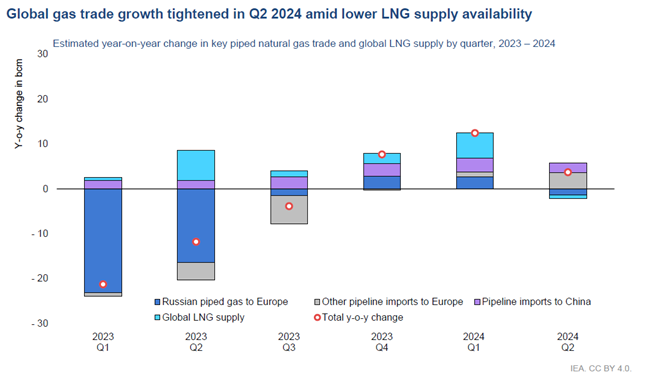
Globally, the International Energy Agency’s (IEA) third-quarter Gas Market Report indicates that world LNG supply growth has slowed in the first half of 2024, increasing by only 2% year-over-year. This growth was concentrated in Q1, with production rising 4.5%. Contrastingly, output fell in Q2 by 0.5%, the first contraction to global LNG growth since COVID-19 lockdowns in 2020. In this quarter, falling LNG production combined with strong Asian demand growth resulted in tightened global gas balance and trade.
The IEA predicts that LNG growth will recover in the second half of 2024 as LNG terminals open or expand. The U.S. will be a key player in this recovery, with the expansion of Freeport LNG, the ramp-up of Plaquemine LNG Phase 1, and the anticipated start-up of Corpus Christi Stage 3. Additionally, the Tortue FLNG plant in West Africa expected online in Q4 will contribute to growth.
Working Gas in Underground Storage
For the week ending July 12, there was a 10 Bcf increase in working gas volumes in underground storage, according to the EIA, bringing total inventories to 3,209 Bcf. The reported underground storage levels are 250 Bcf higher than this week last year and a 465 Bcf, or 16.9 percent increase from the rolling five-year average of 2.744 Bcf. As reported by EIA’s Today in Energy, there has been less natural gas injected into storage this injection season (April – October) than normal. May and June injections averaged 11 and 31 percent below the five-year averages. Although injections are below average, storage levels are above previous and five-year averages.
EIA also reported less natural gas was drawn from storage inventories this past winter heating season (2023-24) as inventories were 13 percent higher than year-ago levels and 18 percent above the five-year average between November to March. Greater end-of-season storage levels could contribute to the above-average inventories, even with below-average injections.
Pipeline Imports and Exports
For the week ending July 17, the EIA reports imports from Canada decreased by 7.9 percent, or 0.6 Bcf per day from the week prior. Exports to Mexico increased 0.3 percent, or less than 0.1 Bcf per day for the same week. As reported by EIA’s Today in Energy, the energy trade value of crude oil, petroleum products, natural gas, and electricity between the U.S. and Mexico fell 15 percent in 2023 from $77.8 billion in 2022 to $65.5 billion in 2023, when adjusted for inflation. EIA expects this depreciation is due to lower fuel prices that more than offset the volume of commodities imported and exported.
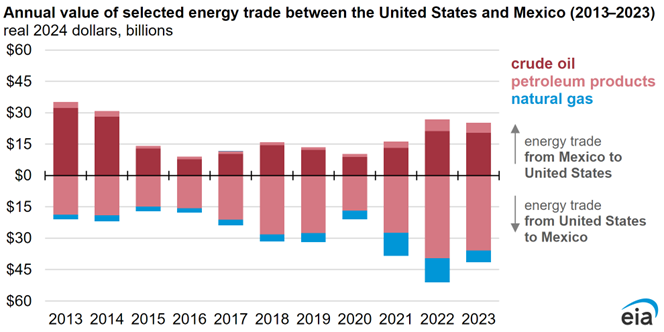
Looking at natural gas specifically, U.S. exports to Mexico reached record high in 2023 with 6.2 billion cubic feet per day, which was 8 percent more than in 2022. These exports to Mexico represented 13 percent of all U.S. energy exports to Mexico in 2023. Despite the increase in volume, the trade value of natural gas decreased 52 percent from 2022 to 2023 due to lower prices, according to the EIA.
Rig Count
Baker Hughes reports 586 rigs in the U.S. for the week ending July 19, a week-over-week increase of 2 rigs, but a year-over-year decline of 83 rigs. The current oil rig count is 477, with a year-over-year decline of 53 rigs. The gas rig count is 103, an increase of 3 from the week prior.
For questions please contact Juan Alvarado | jalvarado@aga.org or Morgan Hoy | mhoy@aga.org
To be added to the distribution list for this report, please notify Lucy Castaneda-Land | lcastaneda-land@aga.org
NOTICE
In issuing and making this publication available, AGA is not undertaking to render professional or other services for or on behalf of any person or entity. Nor is AGA undertaking to perform any duty owed by any person or entity to someone else. Anyone using this document should rely on his or her own independent judgment or, as appropriate, seek the advice of a competent professional in determining the exercise of reasonable care in any given circumstances. The statements in this publication are for general information and represent an unaudited compilation of statistical information that could contain coding or processing errors. AGA makes no warranties, express or implied, nor representations about the accuracy of the information in the publication or its appropriateness for any given purpose or situation. This publication shall not be construed as including, advice, guidance, or recommendations to take, or not to take, any actions or decisions regarding any matter, including without limitation relating to investments or the purchase or sale of any securities, shares or other assets of any kind. Should you take any such action or decision; you do so at your own risk. Information on the topics covered by this publication may be available from other sources, which the user may wish to consult for additional views or information not covered by this publication.
Copyright © 2024 American Gas Association. All rights reserved.