Natural Gas Market Indicators – June 26, 2024
Natural Gas Market Summary
Recent heatwaves and international developments are influencing the natural gas market. In the U.S., record-breaking temperatures in cities across Central and Eastern regions have resulted in surging electricity demand, leading to increased natural gas consumption. Notably, in New England, power demand has soared to meet cooling needs. Even with the retirement of the Mystic Generating Station, the vast majority of electricity generation in New England has been met using natural gas. Additionally, petroleum consumption for power generation rose during peak periods.
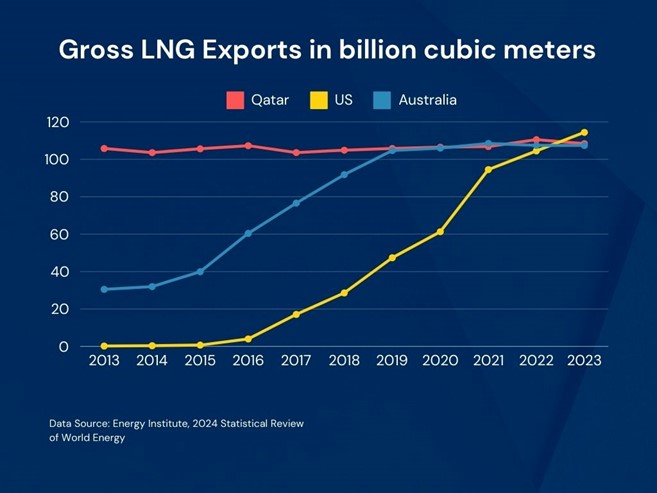
Internationally, the U.S. has emerged as the world’s largest LNG exporter, surpassing Qatar and Australia in 2023. According to the Energy Institute’s Statistical Review of World Energy released on June 20, U.S. LNG exports have seen a 93.8% annual increase over the past decade. Meanwhile, recent E.U. sanctions on Russian LNG could disrupt global supply chains and European economies. While impactful, the E.U. sees the sanction as a necessary response to Russia’s invasion of Ukraine.
Reported Prices
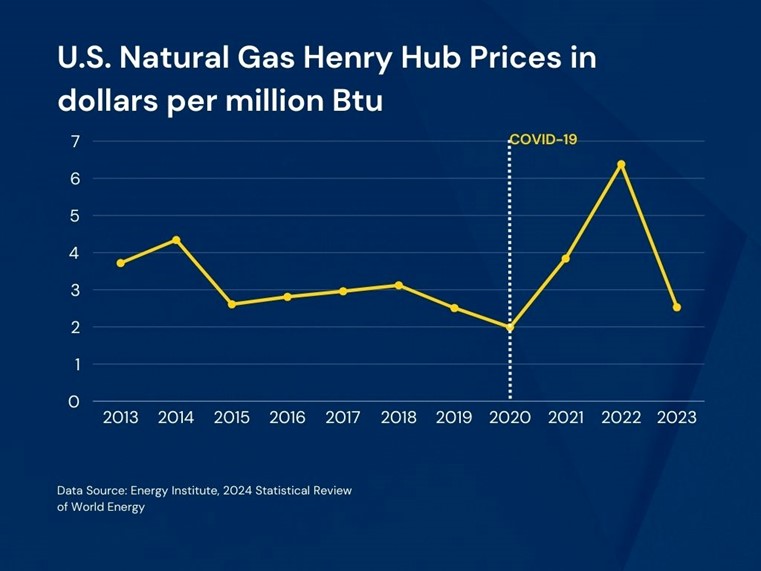
July contract prices are $2.80 per MMBtu as of June 26, as reported by CME. This price is closer to the higher end of Henry Hub July futures reported by the EIA between June 10 and June 18. During this period prices have ranged, with a high of $2.80 per MMBtu on June 12 and a low of $2.43 per MMBtu on June 18 and 16. Looking at 2023 data released by Energy Institute’s Statistical Review of World Energy, July futures are in line with 2023’s average of $2.53 per MMBtu. Notably, this 2023 average was a 60% fall from 2022, bringing U.S. prices back to their pre-COVID level.
Weather
For the week ending in June 22, temperatures were 68.2 percent warmer than last year and 37 percent warmer than normal as measured by cooling degree days. Regionally, New England saw the largest change in weather from the same week last year with a 1,533.3 percent increase (albeit from a small base of 3 CDDs in 2023). The heatwave sweeping the nation has led to several U.S. cities breaking decade-long records, according to Reuters. Heat advisories were issued from central states to the East Coast, affecting over 80 million people. On June 17, Chicago reached 97 degrees Fahrenheit, and Syracuse reached 94 degrees Fahrenheit, breaking record temperatures from 1957 and 1994 respectively. NASA has determined that the number of summer heat waves has doubled from 1980 to 2023, averaging four a month.

According to NASA, temperatures are expected to decrease across Central and Western states on June 26, expanding to the East Coast on June 27. Into July, heat is expected to spread from the South to the North, with a concentration in the Southeast. As of June 24, there is no reported hurricane activity, according to NOAA.
Demand
As reported by the EIA, total U.S. consumption rose by 1.7 percent, or 1.1 Bcf per day week over week, from an average of 67.5 to 68.6 Bcf per day for the week ending on June 12. This is a 0.4 percent increase in U.S. consumption when compared with this week last year. Industrial demand fell from 21.8 to 21.6 Bcf per day, and residential/commercial demand fell from 9.6 to 9.2 Bcf per day from last week. Power demand increased from a daily average of 36.1 to 37.8 Bcf per day, a 4.7 percent increase week over week.
U.S. heatwaves are contributing to the spike in power demand. As reported by the EIA, New England saw a significant increase in electricity demand from June 19 to June 20, increasing the reliance on natural gas. Natural gas consumption in New England increased from 1.2 to 2.0 Bcf per day in a week to meet power demand. Additionally, in 2023, coal generation suffered more outages than other types of power generation due to aging units and increased cycling to support renewable sources as reported by NERC. This expected increase in the frequency of outages, as well as scheduled retirements of coal plants in the next several years, could cause natural gas reliance to spike from the need for alternative fuel.
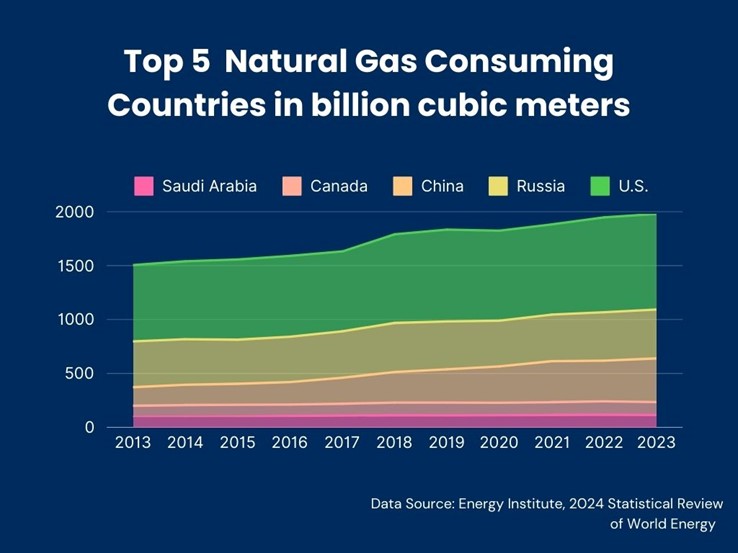
Internationally, natural gas total world consumption has increased 1.7 percent per year from 2013 to 2023, according to the Energy Institute’s Statistical Review of World Energy. This upward trend is evident in the top five consuming countries. The U.S. remain the top world consumer of natural gas, making up 22.1 percent of the world’s share in 2023. Russia, China, Canada, and Saudi Arabia follow, making up 11.3, 10.1, 3.0, and 2.8 percent of total consumption for the same year.
Production
The EIA reports 99.3 Bcf per day in production for the week ending June 12, a 0.3 Bcf per day decrease from last week’s production of 99.6 Bcf per day. This is a year-over-year decrease of 3.3%.
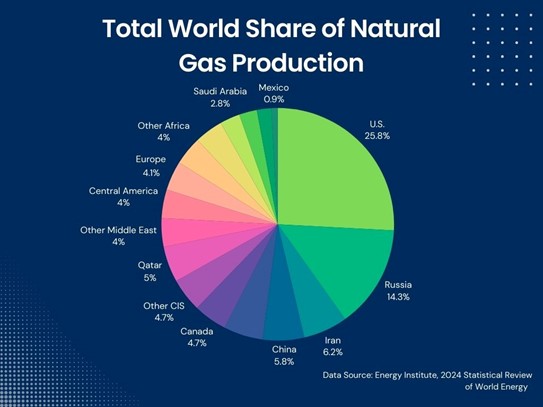
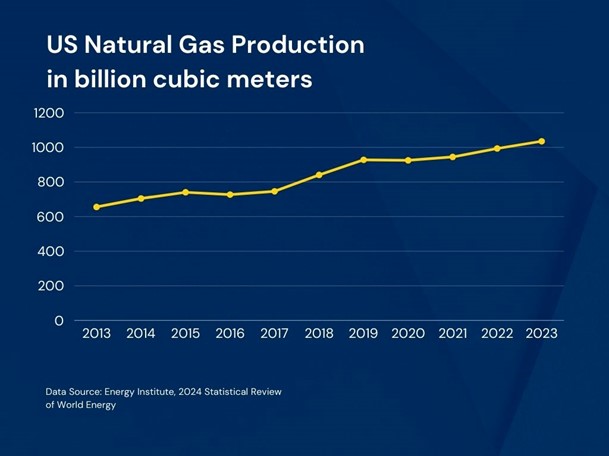
On a broader scale, natural gas production in the U.S. has grown steadily since 2013, according to the Energy Institute’s Statistical Review of World Energy. The 10-year per annum growth rate from 2013 to 2023 was 4.7% per year; and 2023 itself showed a 4.2% growth from 2022 production levels. Overall, in 2023 the U.S. accounted for 25.5 percent of total world natural gas production, marking the U.S. as the largest producer in the world. Natural gas output in both Europe and the Commonwealth of Independent States fell by 7 percent and 4 percent respectively for the same year.
LNG Markets
Natural gas deliveries to U.S. LNG export terminals decreased 0.3 Bcf per day from 13.2 Bcf per day to 12.9 Bcf per day for the week ending in June 14, according to the EIA’s Natural Gas Weekly Update. Additionally, twenty-five LNG vessels with a combined carrying capacity of 94 Bcf departed from the U.S. between June 6 and June 12.
The U.S. has become the world’s largest exporter of LNG, overtaking Qatar and Australia in 2023 according to the Energy Institute’s Statistical Review of World Energy. Over the last ten years the U.S. had a 93.8 percent increase in LNG exports per year. Comparatively, Qatar and Australia experienced a 0.2 percent increase and a 13.4 percent increase over the same period.
In other international news, this past week, the E.U. approved unprecedented sanctions on Russia within the LNG market, according to an article published by Political Pro. The E.U. has left Russian gas unpenalized since the invasion of Ukraine but will now ban the resale of Russian LNG imports. While a mere 5 percent of Russian LNG made up the E.U.’s gas consumption in 2023, it still raised around 8 billion euros for the country and may force Moscow to overhaul its LNG business model. The E.U. is making additional efforts to block Russia from bypassing the E.U. markets and shipping LNG to Asia directly through the Arctic Sea. According to Politico Pro, the blocks against Russian LNG are an effort to drain their resources after their 2022 invasion of Ukraine. Since the invasion, E.U.’s demand for Russian gas has decreased by over 60 percent.
According to Reuters, China has consumed a record of 55 million metric tons of natural gas in the first five months of 2024. Their supply is partially overland pipelines and sea-borne LNG. China’s LNG imports have been above year-over-year levels from January to May, likely taking advantage of lower spot prices and the decreased European demand for LNG due to their excess supply from the previous winter season. As the Asian LNG spot market price climbs from $9 per MMBtu in February to $12 per MMBtu in June and storage facilities fill, more LNG imports could shift to European markets.
Working Gas in Underground Storage
There was a 71 Bcf increase in net injections into underground storage for the week ending on June 14, according to the EIA’s Natural Gas Storage Dashboard. This increase in storage brings the total working stock to 3,045 Bcf. The reported underground storage levels are 22.6 percent, or 561 Bcf, higher than the five-year average, and 12.7 percent Bcf higher year-over-year, or 343 Bcf higher year-over-year.
Pipeline Imports and Exports
For the week ending June 12, the EIA reports imports from Canada increased 0.4 Bcf per day, or 6.8 percent from the previous week. For the same week, exports to Mexico increased 0.1 Bcf per day, or 1.4 percent from the week prior.
Rig Count
Baker Hughes reports 588 rigs in the U.S. for the week ending June 21, a week-over-week decline of 2 rigs. This is a 13% decline from the same week last year. The current oil rig count is 485, having declined 11.2 from year-ago levels. The gas rig count is 98, down 25% from the same week last year.
For questions please contact Juan Alvarado | jalvarado@aga.org or Morgan Hoy | mhoy@aga.org
To be added to the distribution list for this report, please notify Lucy Castaneda-Land | lcastaneda-land@aga.org
NOTICE
In issuing and making this publication available, AGA is not undertaking to render professional or other services for or on behalf of any person or entity. Nor is AGA undertaking to perform any duty owed by any person or entity to someone else. Anyone using this document should rely on his or her own independent judgment or, as appropriate, seek the advice of a competent professional in determining the exercise of reasonable care in any given circumstances. The statements in this publication are for general information and represent an unaudited compilation of statistical information that could contain coding or processing errors. AGA makes no warranties, express or implied, nor representations about the accuracy of the information in the publication or its appropriateness for any given purpose or situation. This publication shall not be construed as including, advice, guidance, or recommendations to take, or not to take, any actions or decisions regarding any matter, including without limitation relating to investments or the purchase or sale of any securities, shares or other assets of any kind. Should you take any such action or decision; you do so at your own risk. Information on the topics covered by this publication may be available from other sources, which the user may wish to consult for additional views or information not covered by this publication.
Copyright © 2024 American Gas Association. All rights reserved.