Natural Gas Market Indicators – March 13, 2025
Natural Gas Market Summary
The first quarter of 2025 has been particularly noisy for the natural gas market. Beyond the extreme cold weather and multiple winter storms that pushed the boundaries for natural gas demand, looming trade tariffs have cast a cloud of uncertainty over the market. The initial 25 percent tariff on imports from Canada and Mexico scheduled to begin on February 4 (10 percent for energy imports, including natural gas) was paused for 30 days on February 3. Then, on March 4, the tariff was briefly implemented before being paused again on March 6. This tariff included a 25 percent import tax on goods that do not satisfy U.S.-Mexico-Canada Agreement (USMCA) rules of origin. However, a lower 10 percent tariff on energy products imported from Canada fell outside the USMCA preference. The USMCA and the Harmonized Tariff Schedule currently do not include a duty rate on natural gas imports, and it is uncertain if one will be placed on natural gas imports from Canada to the U.S. Furthermore, it is unclear whether the USMCA will be renegotiated or altered.
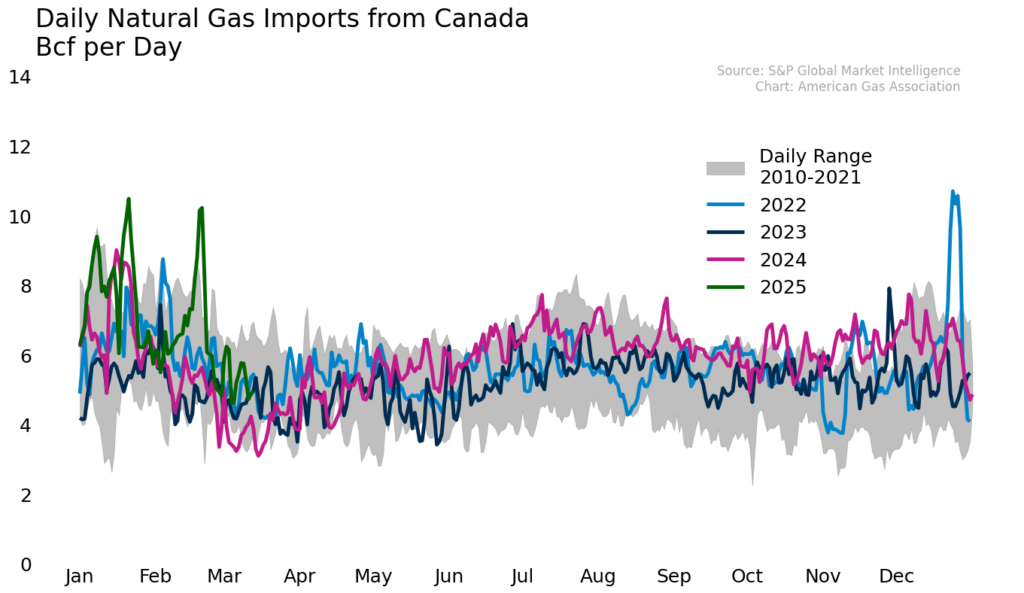
Potential longer-term impacts are difficult to predict, particularly if additional tariffs affect natural gas imports. In the short term, the natural gas market does not appear to have been adversely affected over the two days the tariffs were in effect. Canadian imports declined for the week ending March 13 but remain consistent with historical averages. Overall consumption also declined due to milder weather, which could indicate flagging imports are related more to decreasing demand for natural gas than the tariffs specifically. Domestic production maintained consistent levels week-over-week, while natural gas futures remain above $4 per MMBtu.
Prices Above $4 Persist Amid Storage Inventory and Tariff Concerns
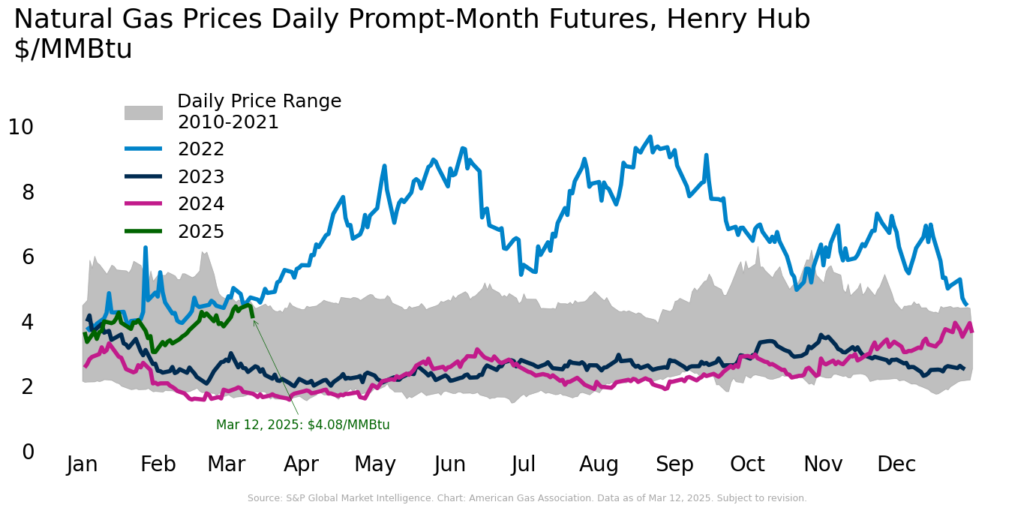
April prompt month Henry Hub prices have averaged $4.24 per MMBtu between February 27 and March 12 despite more mild weather. On Monday, March 10, futures prices reached a new winter heating season high of $4.49 per MMBtu, a price last realized in February 2022. At close on Wednesday, March 12, prices had softened approximately 9 percent to $4.08 per MMBtu relative to the season high. For the season to date, average futures prices are trading 43 percent higher than over the same period during the 2023-2024 winter heating season at $3.54 per MMBtu for the current season relative to $2.47 per MMBtu a year ago. Prices have remained elevated in recent weeks due to lower natural gas storage inventory and market reactions to tariffs that could affect the natural gas market in North America.
From the perspective of Henry Hub spot prices, the EIA’s March 2025 Short-Term Energy Outlook (STEO) estimates the 2025 average spot price to be $4.19 per MMBtu, up nearly 11 percent from the February 2025 STEO estimate. For 2026, the EIA raised its estimated average spot price to $4.47 per MMBtu, an increase of 7.6 percent. Henry Hub spot prices closed at $4.23 per MMBtu on March 10, up nearly 175 percent compared to the same time last year. For the current winter heating season, average spot prices are up 38 percent compared to the same period last year, from an average of $2.47 per MMBtu through March 10, 2024, to $3.42 per MMBtu through March 10, 2025.
Lion or Lamb? Mixed Forecast mid-March
Following a February that was 0.6 percent colder than the 30-year normal, temperatures for the week ending March 8 fell in line with normal, as measured by gas-weighted heating degree days. All regions experienced colder temperatures than last year, and all regions except the Middle Atlantic, East North Central, West North Central, and West South Central experienced colder than normal temperatures.
Into the weekend, March may rear its lion head. CNN Weather reports the potential for heavy rainfall, strong winds, wildfire risk, and blizzard conditions beginning on the West Coast on Wednesday and moving through the Plains and East Coast by Saturday. Following the storm, NOAA’s temperature outlook indicates a split forecast for the lower-48, with above-normal temperatures across the East Coast, below-normal temperatures in the western states, and near-normal temperatures in the central U.S.
Demand Declines with Warmer Temperatures
Preliminary data from S&P Global Commodity Insights suggests total demand, including exports, fell 6.9 percent for the week ending March 13 as temperatures warmed following the winter events occurring in late February. This decline was experienced in all sectors, led by a 16.7 percent decrease in the residential and commercial sectors. Relative to the same period last year, total demand is up 2.9 percent, residential and commercial demand increased 5.8 percent, industrial demand increased 1.9 percent, and power demand fell 4.3 percent.
Rystad Energy’s current U.S. gas demand forecast suggests that total natural gas consumption for March will reach 97.2 Bcf per day, an increase of 7.9 percent over March 2024 levels. Growth is expected to be concentrated in the residential and commercial sectors, which are expected to increase by 16.6 percent and 12.8 percent, respectively. For the year, total demand is forecast to increase by 4.2 Bcf per day, or 4.7 percent, over the average daily demand in 2024. Rystad’s annual and monthly forecasts are slightly higher than the forecasts in the EIA’s March STEO. The EIA anticipates monthly natural gas demand to increase 5.3 percent over March 2024, and annual demand to increase 1.8 percent over 2024. Additionally, the EIA anticipates consumption to decline by 0.72 Bcf per day in 2025 for the electric power sector, while Rystad forecasts an increase of 1.6 Bcf per day.
Total Production Rises Year-Over-Year
For the week ending March 13, average daily dry gas production in the U.S. maintained levels consistent with last week and increased more than 3 Bcf per day relative to the same period last year. Regionally for the week:
- The Southeast saw the largest gains in production levels week-over-week, increasing 2.3 percent
- Production is up year-over-year in all regions except the Southeast, Rockies, Midwest, and Southwest
- Production increased 7.4 percent relative to the same period last year in the Northeast, but fell 0.1 percent compared to last week
- In the Southwest, production declined 2.6 percent from last week and 2.8 percent year-over-year
LNG Exports Rise in Early March
According to the EIA, 32 LNG vessels—most from Sabine Pass—departed the U.S. between February 27 and March 5, an increase of three vessels over the prior week. In total, the number of vessels contained a combined carrying capacity of 122 Bcf, an increase of 13 percent. Over the same period, LNG feedgas deliveries softened from the record high reached on February 23, ending 6.1 percent lower on March 4, the lowest point since the peak, according to data from S&P Global Commodity Insights. For the week ending March 11, average daily feedgas volumes posted a small loss of 0.9 percent week-over-week. Despite these short-term movements, feedgas volumes remain more than 16 percent higher than over same period last year.
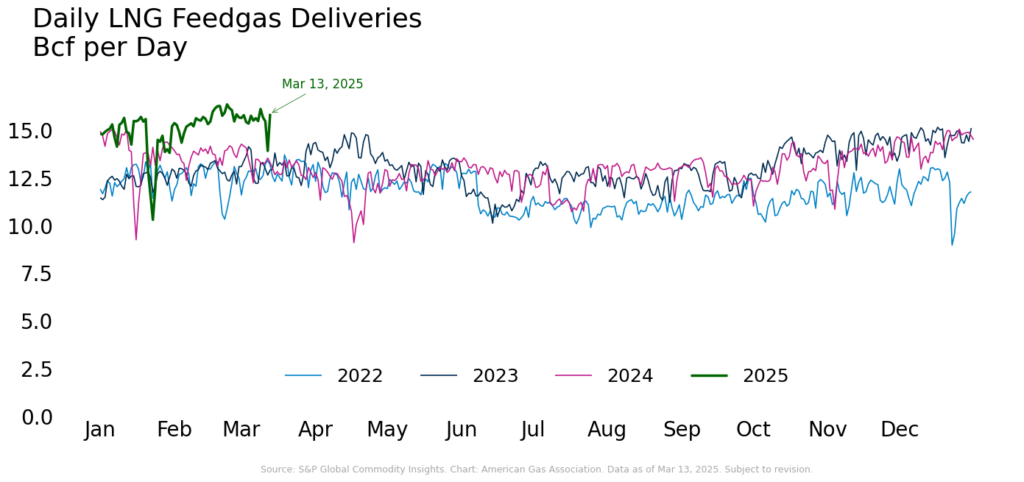
Additionally, the newly opened Corpus Christi Stage 3 LNG export terminal produced its first LNG cargo in February 2025. Production began at the new addition to the existing Corpus Christi facility in December. As part of its updated March STEO, the EIA stated that it did not expect China’s tariffs on U.S. imports to affect domestic LNG exports as LNG cargoes can be rerouted to other international markets.
Storage Inventories Nearly 12 Percent Below Five-Year Average
The EIA reported net underground natural gas inventory withdrawals of 62 Bcf in the lower-48 for the week ending March 7, bringing current inventories to 1,698 Bcf. Compared to the same period last year, natural gas storage inventory is down 27 percent and is currently lagging the five-year average by nearly 12 percent. Regionally, the largest week-over-week change occurred in the East, where storage declined 9.7 percent. All other regions posted declines as well, except the South Central, which experienced a 0.3 percent increase.
In the March STEO, the EIA revised its natural gas storage inventory outlook for the end of March to just under 1,700 Bcf, a 6.4 percent reduction from the February outlook. For the year, the EIA estimates storage inventories to be a little more than 3,000 Bcf at year-end, a reduction of nearly 4 percent from the February forecast. In 2026, inventories are expected to dip to 2,900 Bcf.
Tariffs Have Limited Short-Term Impact on Canadian Imports
Canadian imports maintained levels in line with the historical average while tariffs were in effect between March 4 and 6. While flows declined, the drop was consistent with typical market movements and may not be directly related to the tariffs. Rather, dampened demand across all sectors due to warmer temperatures likely influenced import levels. Compared to the previous year, S&P Global Commodity Insights data suggests that Canadian imports were up 35.9 percent while the tariffs were in place. In the Midcontinent, Northeast, and Rockies average daily net flows with Canada increased compared to last year. The West was the only region to experience a decline year-over-year between March 4 and 6, with average daily net flows declining by 3.3 percent.
For the week ending March 13, preliminary data from S&P Global Commodity Insights suggests exports to Mexico increased by 0.6 percent over the previous week and 1.2 percent compared to the same period last year.
Natural Gas Rig Activity Softens
According to Baker Hughes, the number of natural gas rigs fell by one from 102 to 101 for the week ending March 7. Compared to last year, the number of natural gas rigs declined by 14 or more than 12 percent. The number of oil rigs remained flat for the week but lag last year by 18 rigs or 3.6 percent. In total, the number of rigs in the U.S., including five miscellaneous rigs, stands at 592 for the week, 30 rigs lower than the same period last year.
What to Watch:
- Pipeline Flows: Will the April 2 tariffs and potential USMCA exemptions disrupt cross-border gas flows or remain a minor market factor?
- Rig Count: Thus far rig counts remain lower in early 2025 than in 2024, will higher prices incentivize new drilling, or will production remain at current levels?
- Weather: With late-winter forecasts diverging across regions, will shifting temperatures contribute to increased heating demand and add additional pressure to bullish pricing sentiments into spring?
For questions please contact Juan Alvarado | jalvarado@aga.org, Liz Pardue | lpardue@aga.org, or
Lauren Scott | lscott@aga.org
To be added to the distribution list for this report, please notify Lucy Castaneda-Land | lcastaneda-land@aga.org
NOTICE
In issuing and making this publication available, AGA is not undertaking to render professional or other services for or on behalf of any person or entity. Nor is AGA undertaking to perform any duty owed by any person or entity to someone else. Anyone using this document should rely on his or her own independent judgment or, as appropriate, seek the advice of a competent professional in determining the exercise of reasonable care in any given circumstances. The statements in this publication are for general information and represent an unaudited compilation of statistical information that could contain coding or processing errors. AGA makes no warranties, express or implied, nor representations about the accuracy of the information in the publication or its appropriateness for any given purpose or situation. This publication shall not be construed as including advice, guidance, or recommendations to take, or not to take, any actions or decisions regarding any matter, including, without limitation, relating to investments or the purchase or sale of any securities, shares or other assets of any kind. Should you take any such action or decision; you do so at your own risk. Information on the topics covered by this publication may be available from other sources, which the user may wish to consult for additional views or information not covered by this publication.
Copyright © 2025 American Gas Association. All rights reserved.