Natural Gas Market Indicators – March 27, 2025
Natural Gas Market Summary
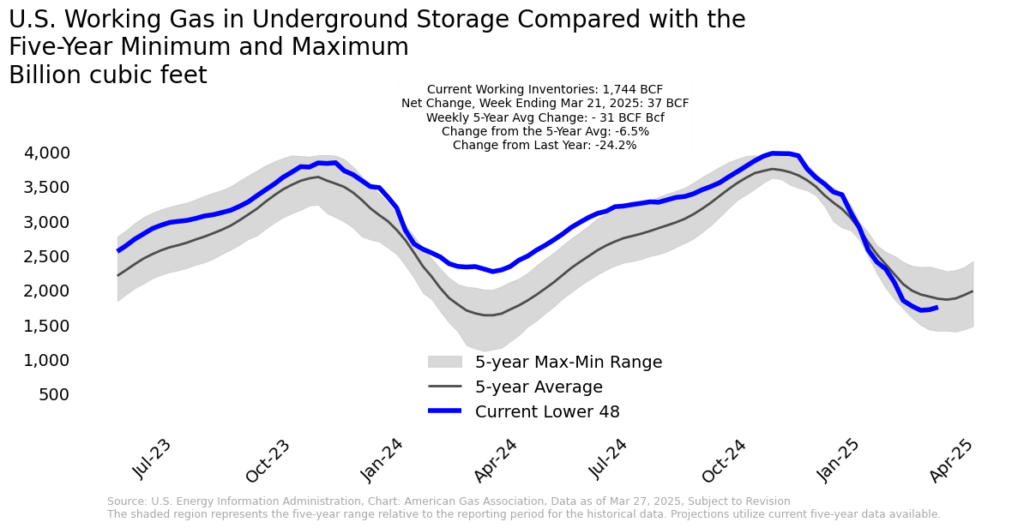
As the 2024-2025 winter heating season nears its close, the natural gas market is finally getting some relief from colder-than-normal weather that heightened demand and decreased underground storage inventories below the five-year average. Due to warmer weather and reduced natural gas consumption in March, depleted storage inventories posted a net increase for two consecutive weeks, with a net injection of 37 Bcf for the lower 48 for the week ending March 21. This is the third-largest weekly net increase in storage inventories ever reported by the EIA during the month of March. Storage inventories now sit 6.5 percent below the five-year average, increasing from a deficit of 11.9 percent two weeks prior. Production for the week ending March 27 declined slightly but remains above 2024 levels, with an all-time daily production record set in the Northeast on March 17. In line with these movements, prompt month prices at Henry Hub fell below $4 per MMBtu for the first time since February 28. Bearish pricing sentiments may continue into early April as warm weather is expected to continue across much of the U.S.
In the LNG market, tariff uncertainty has yet to dampen growth. Despite China halting imports of U.S. LNG for more than 40 days to date, daily LNG feedgas flows continue to set all-time records. Additionally, with the current Administration lifting the freeze on new export permits on January 20, the U.S. is well-positioned to meet growing global LNG demand. As of this writing, the Department of Energy has approved five LNG-related projects since the freeze was lifted. U.S. LNG imports may be particularly critical for the European Union as they begin to refill lower storage inventories following the winter season. As of March 25, storage inventories in the E.U. are 33.6 percent full, 11.6 percentage points below the five-year average.
Prices Fall Below $4 with Bump in Storage Stocks
April prompt month Henry Hub prices settled at $3.86 per MMBtu on March 26 according to CME, falling below $4.00 per MMBtu on March 20 after 13 consecutive trading days above the $4 mark. Prompt month prices have averaged $4.15 per MMBtu through March 26, reaching a new winter season high of $4.49 per MMBtu on March 10, despite milder weather. Underground storage inventories below the five-year average and market uncertainties from tariffs contributed to bullish prices. Futures prices have likely fallen below the $4 threshold in late March due to an unexpected increase in storage volumes fueled by warm weather conditions across the U.S that dampened total demand and reduced storage withdrawals. Prior to market close on March 20, the EIA reported a net increase in working gas stocks for the week ending March 14, the first net injection since November 8, 2024. April futures prices opened at $4.21 per MMBtu the morning of March 20 before settling at $3.98 per MMBtu for the day. In the spot market, Henry Hub prices have averaged $4.18 per MMBtu in March, settling at $4.03 per MMBtu on March 24, according to the EIA.
Warmer Weather Continues for Much of U.S.
Warmer weather is expected to extend into early April for much of the lower 48. According to the March 23 outlook, the National Oceanic and Atmospheric Administration (NOAA) expects above-normal temperatures for most of the continental U.S. and Hawaii, with Western states and Alaska expected to experience below-normal temperatures through April 6. The graphic below illustrates the forecast of daily high temperatures through April 3, according to Weather Trader.
For the week ending March 15, weather in the U.S. was 3.4 percent warmer than last year and 27.3 percent warmer than the 30-year normal, as measured by gas-weighted heating degree days. Regionally, all areas experienced warmer-than-normal weather relative to last year with the exception of the Middle Atlantic, South Atlantic, Pacific, and New England. Compared to the 30-year normal, all regions experienced warmer than normal weather with the exception of the Pacific.
Short-Run Gains and Year-Over-Year Losses in Natural Gas Demand
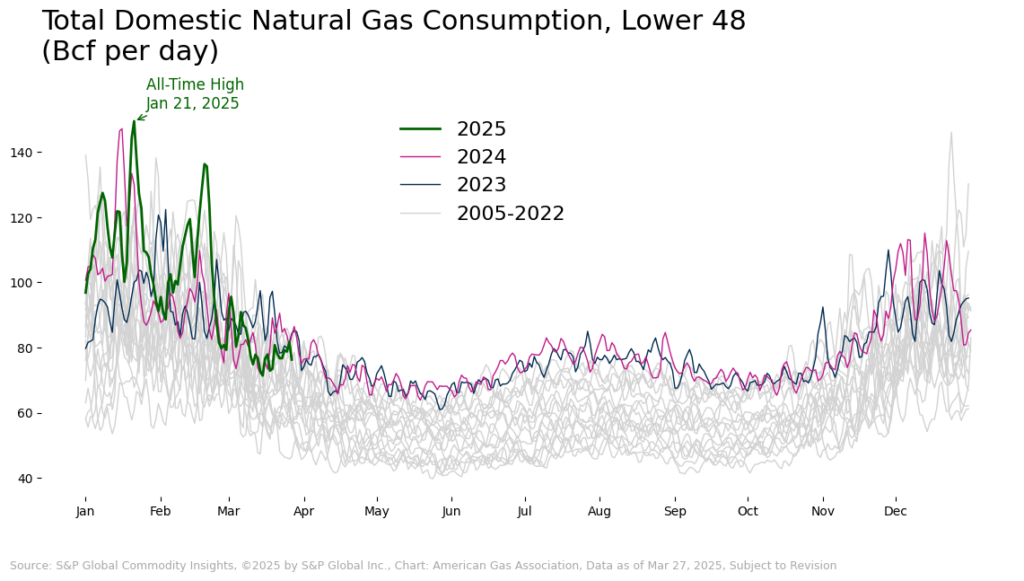
According to preliminary data from S&P Global Commodity Insights, average daily U.S. demand, including exports, increased 3.8 percent for the week ending March 27 but was down 3.6 percent for the same week last year. By comparison, average daily domestic consumption for the week was up 4.1 percent, primarily driven by a 7.6 percent increase in the Residential/Commercial sector. Compared to the same week last year, consumption fell 8.1 percent, driven by a 14 percent decrease in Residential/Commercial consumption. Electric Power and Industrial consumption are down 5.6 percent and 3.6 percent year-over-year, respectively.
Regionally for the week ending March 27:
- Year-over-year, consumption fell in all regions, ranging from a 2.4 percent decline in the Southeast to a 21.5 percent decline in the Rockies
- The Northeast, Midwest, Southeast, and Texas posted week-over-week consumption gains, ranging from 0.7 percent in the Southeast to 18.2 percent in the Midwest
- Compared to last week, natural gas consumption fell in the Midcontinent, Northwest, Southwest, and Rockies, with the largest decrease of 24.5 percent occurring in the Northwest
- The Northwest consumption decline was mainly driven by a 36.2 percent decrease in the Residential/Commercial sector
Northeast Sets New Production Record
Average daily domestic natural gas production fell 0.2 percent week-over-week for the week ending March 27, according to preliminary data from S&P Global Commodity Insights. Relative to one year ago, production for the week is up 5 percent.
Regionally for the week ending March 27:
- Production increased in the Northeast, Texas, Midcontinent, and Southwest year-over-year, with the largest increase of 10.2 percent occurring in the Northeast
- Production decreased in the Midwest, Southeast, and Rockies year-over-year, with the largest decrease of 3.5 percent occurring in the Midwest
- Week-over-week, regional production increased in every region but the Southeast and Texas
- The Northeast set a new daily production record on March 17
LNG Feedgas Flows Continue to Rise
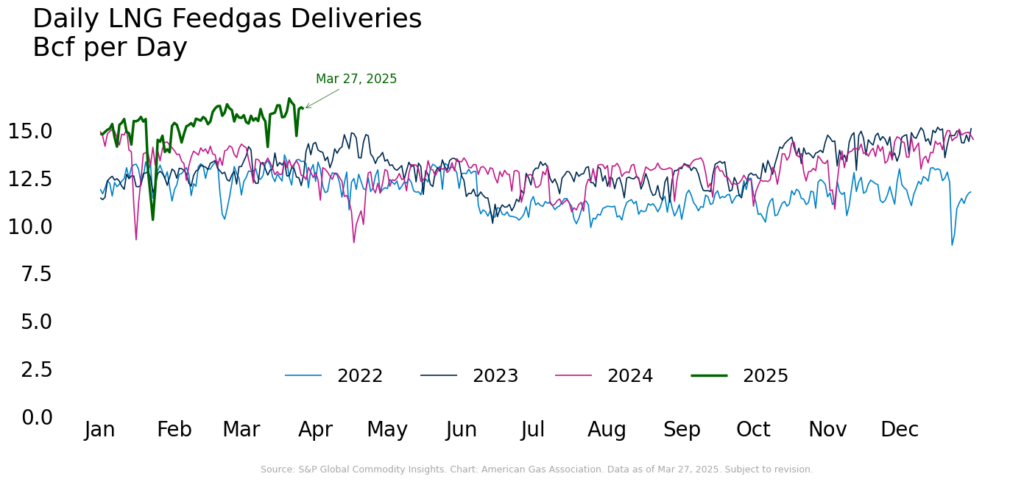
According to the EIA, 26 LNG vessels departed from the U.S. between March 13 and 19, with a combined carrying capacity of 98 Bcf. Compared to last week, the total number of vessels departing from the U.S. declined by three and combined carrying capacity decreased by 12 Bcf. Over the same period, average daily LNG feedgas deliveries increased over the previous week by 3.4 percent, according to data from S&P Global Commodity Insights. Most recently, for the week ending March 27, average daily feedgas deliveries increased 0.7 percent over last week and 24.4 percent over last year.
LNG feedgas deliveries have shattered multiple daily records since Plaquemines and Corpus Christi Stage 3 began producing cargo in late 2024 and early 2025. Preliminary data from S&P Global Commodity Insights indicates that the most recent daily record was set on March 21. Reuters also reports that March is on track to set a new monthly record for average daily feedgas flows, reaching 15.7 Bcf per day as of March 17, up from the record of 15.6 Bcf per day set in February 2025.
This record setting may continue into the year, since the White House lifted the freeze on new export permits on January 20 that had been set by the previous administration. According to Reuters, five LNG-related projects have been approved by the Department of Energy since the freeze was lifted, with Venture Global’s CP2 LNG project in Cameron Parish being granted approval most recently on March 19. The CP2 project has an estimated export capacity of 20 million metric tons per annum and remains subject to final approval from other federal regulators.
Storage Inventories Post Second Net Increase for the Year to Date
For the week ending March 21, the EIA reports a net injection of 37 Bcf into underground storage, bringing the total working gas stocks to 1,744 Bcf. Inventories now sit 6.5 percent below the five-year average and lag year-ago levels by 24.2 percent. All regions except the Mountain and Pacific experienced net injections for the week. The largest positive week-over-week change occurred in the South Central region, where working gas stocks increased by 5.4 percent. The largest decrease occurred in the Mountain region, where inventories fell 1.2 percent but remain 50.9 percent above the regional five-year average.
Canadian Imports, Exports to Mexico Positive Year-Over-Year
Average daily natural gas imports from Canada increased 13.5 percent for the week ending March 27 relative to the previous week, according to preliminary data from S&P Global Commodity Insights. Compared to the same period last year, Canadian imports are up nearly 21 percent. By comparison, average daily exports to Mexico increased 8.9 percent week-over-week and 6.7 percent year-over-year for this period.
Natural Gas Rig Activity Ticks Up
According to Baker Hughes, the total number of U.S. natural gas rigs increased from 100 to 102 for the week ending March 21. Compared to the same period last year, the number of natural gas rigs declined by 10, or 8.9 percent. Total rig count stands at 593, including 486 oil rigs and 5 miscellaneous rigs, down 5 percent from last year.
What to Watch:
- LNG Feedgas: With new LNG export permits in place, will feedgas continue to set new records into 2025?
- Storage: Do early storage injections indicate a strong refill season, and could further injections be enough to close the gap with the five-year average ahead of peak summer demand?
- Prices: Warmer weather has given natural gas futures prices a respite. Will the market remain bearish as injection season begins despite lagging storage inventory?
For questions please contact Juan Alvarado | jalvarado@aga.org, Liz Pardue | lpardue@aga.org, or
Lauren Scott | lscott@aga.org
To be added to the distribution list for this report, please notify Lucy Castaneda-Land | lcastaneda-land@aga.org
NOTICE
In issuing and making this publication available, AGA is not undertaking to render professional or other services for or on behalf of any person or entity. Nor is AGA undertaking to perform any duty owed by any person or entity to someone else. Anyone using this document should rely on his or her own independent judgment or, as appropriate, seek the advice of a competent professional in determining the exercise of reasonable care in any given circumstances. The statements in this publication are for general information and represent an unaudited compilation of statistical information that could contain coding or processing errors. AGA makes no warranties, express or implied, nor representations about the accuracy of the information in the publication or its appropriateness for any given purpose or situation. This publication shall not be construed as including advice, guidance, or recommendations to take, or not to take, any actions or decisions regarding any matter, including, without limitation, relating to investments or the purchase or sale of any securities, shares or other assets of any kind. Should you take any such action or decision; you do so at your own risk. Information on the topics covered by this publication may be available from other sources, which the user may wish to consult for additional views or information not covered by this publication.
Copyright © 2025 American Gas Association. All rights reserved.