Natural Gas Market Indicators – May 22, 2024
Natural Gas Market Summary
The National Electric Reliability Council released its annual summer reliability assessment, indicating that all areas are assessed as having adequate resources for summer peak loads, but some areas may face supply shortfalls during extreme summer conditions. Rising electricity demand is a challenging resource and transmission adequacy in some areas, according to the assessment. Notably, the NERC says that the “natural gas supply and infrastructure is vitally important to electric grid reliability, particularly as variable energy resources satisfy more of our energy needs. Fuel supply and delivery infrastructure must be capable of meeting the ramp rates of natural-gas-fired generators as they balance the system when wind and solar generation output declines.”
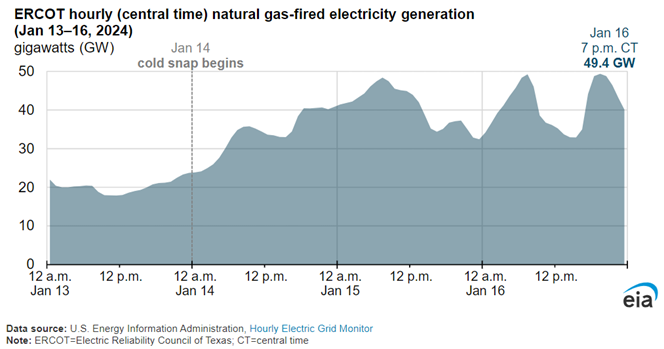
In other news this week, LNG is a primary topic as the lead contractor for the $10 billion Golden Pass LNG Plant in Texas filed for bankruptcy, prompting ExxonMobil to explore continued support for the project. Internationally, the European Union is now considering restricting Russian LNG exports due to the ongoing war in Ukraine. Finally, the Texas grid operator ERCOT recorded a new high for natural gas usage in power generation during an hour in January, reaching 49.4 GW due to a cold snap, slightly surpassing the previous winter record and nearing the all-time summer high. The EIA noted that ERCOT’s power generation demand peaks in both summer and winter and the peak demand for power generation is primarily supplied by natural gas.
Reported Prices
As May nears its close, June futures at Henry Hub are trading at roughly $2.64 per MMBtu as of May 22. Futures remain above $2.00 per MMBtu through October and then rise to roughly $3.19 per MMBtu in November of 2024, remaining elevated above $3.00 per MMBtu through November 2025.
Weather
Warmer than normal temperatures are forecasted for the East and part of the Midwest through Memorial Day weekend and into next week as outlined in NOAA’s 16-day forecast. NOAA issued an announcement that they would be releasing their 2024 hurricane season forecast in a news conference on May 23. While Colorado State University has predicted an “extremely active” hurricane season, it is unclear is NOAA’s forecasts will align as the hurricane season officially begins on June 1.
Demand
The EIA’s May 16 edition of Today in Energy reports that the Electric Reliability Council of Texas (ERCOT) recorded a record high of natural gas used for power generation for an hour in January as a three-day cold snap increased demand for electricity. The new record for hourly winter demand sits at roughly 49.4 GW on January 16, 2024, about 1% higher than the previous high of 48.8 GW recorded on December 23, 2022. Although not the all-time record high, the 49.4 GW is within 4% of the summer hourly high of 51.2 GW set on August 25, 2023. The EIA goes on to reiterate how power generation demand typically peaks in both the summer and winter for ERCOT, and how the surges in demand are primarily supplied by natural gas-fired generation.
Taking a closer look, demand for natural gas rose an average of 5.1 Bcf per day from the week prior as reported by the EIA. The rise from 68.6 to 73.7 Bcf per day was primarily the result of the 5.6 Bcf per day increase in consumption in the residential and commercial sectors from 14.7 to 20.3 Bcf per day. The roughly 38 percent rise in consumption in the residential and commercial sectors is primarily due to the cooler temperatures in the Mid-West and East during this report period.
Production
The EIA reports a small increase in production week-over-week, rising 0.3 Bcf per day from 98.8 to 99.1 Bcf per day for the week ending May 15. Although there has been a reported week-over-week increase, production levels are 2.9 Bcf per day lower than the average daily output for the same time last year. As commodity prices continue to remain subdued, the May 13 release of the EIA Drilling Productivity Report forecasts a decline in production from five of the seven natural gas shale regions, while only the Bakken and Permian basins are anticipated to have a 0.02 and 0.14 Bcf per day increase.
LNG Markets
Natural gas deliveries to U.S. LNG export terminals increased 0.4 Bcf per day, or 3.5%, week-over-week from 12.3 to 12.7 Bcf per day for the week ending May 15 according to the EIA Natural Gas Weekly Update. Of note, twenty-eight LNG vessels with a combined carrying capacity of 102 Bcf departed the U.S. between May 9and 15. The Pipeline & Gas Journal reports that the lead contractor, Zachary Holdings, for the $10 billion LNG Plant in Texas known as Golden Pass LNG filed for Chapter 11 bankruptcy on Tuesday, May 21. ExxonMobil, one of the two partners on the project, released a statement reiterating that they are meeting with stakeholders to consider all paths forward to continue their support of the project.
In global news, Reuters reports that the European Union is considering restricting Russian LNG exports as the war in Ukraine continues. The restriction is being proposed as an “EU ban provision of re-loading services by EU facilities for trans-shipment of Russian LNG to third countries” as outlined in the article. The new provisions would also ban “new investments and the provisions of goods, technology and services by EU operators for the completion of LNG projects under construction such as Arctic LNG and Murmansk LNG.” as reported by a previous Reuters article. Both Arctic LNG and Murmansk LNG are Russian-based projects under construction to meet Russia’s goal of increasing their participation in the global LNG market. Belgium, Germany, and France have asked the European Commission for “assessments on whether a ban on LNG transshipments at European ports will hit the Russian economy more than the EU’s.”
International prices were mixed for the week ending May 15. Futures our of JKM remained stable week-over-week, holding at $10.46 per MMBtu, $0.20 lower than the same time last year. Futures out of TTF declined $0.27 from $9.23 to a weekly average of $9.50 per MMBtu.
Working Gas in Underground Storage
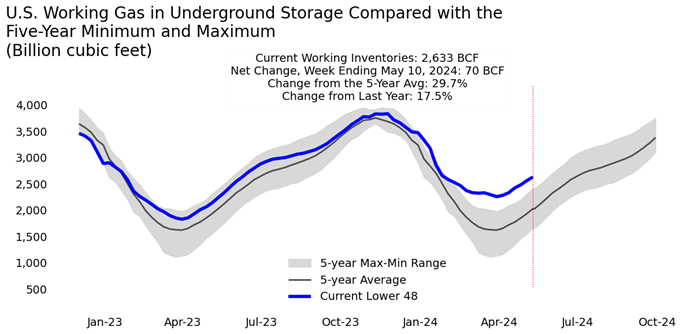
The beginning of refill season continues with 70 Bcf injected into storage for the week ending May 10 as reported by the EIA’s Natural Gas Storage Dashboard. The addition brings working gas in underground storage to 2,633 Bcf, roughly 620 Bcf or 30 percent higher than the five-year average. Current levels are also 18 percent higher than at the same time last year.
Pipeline Imports and Exports
For the week ending May 15, Imports from Canada declined an average of 0.2 Bcf per day from 5.5 to 5.3 Bcf per day. Alternatively, exports to Mexico have increased marginally from a daily average of 6.7 to 6.8 Bcf per day.
Rig Count
Baker Hughes reports a total of 604 rigs for the week ending May 17, a week-over-week increase of one rig but still 16 percent below May 2023. Crude oil rigs remain the dominant type. At 497 rigs, oil-directed activity accounts for four out of every five rigs in operation. The lower commodity price environment has contributed to the pullback in activity since last year, with steeper declines in the gas rig count relative to oil. Rigs in the Marcellus have dropped 26 percent from year-ago levels, and the Haynesville is down 39 percent over that time. By contrast, the Permian rig count is down 10 percent even though crude oil prices at WTI have slightly increased since May 2023.
For questions please contact Juan Alvarado | jalvarado@aga.org or Morgan Hoy | mhoy@aga.org
To be added to the distribution list for this report, please notify Lucy Castaneda-Land | lcastaneda-land@aga.org
NOTICE
In issuing and making this publication available, AGA is not undertaking to render professional or other services for or on behalf of any person or entity. Nor is AGA undertaking to perform any duty owed by any person or entity to someone else. Anyone using this document should rely on his or her own independent judgment or, as appropriate, seek the advice of a competent professional in determining the exercise of reasonable care in any given circumstances. The statements in this publication are for general information and represent an unaudited compilation of statistical information that could contain coding or processing errors. AGA makes no warranties, express or implied, nor representations about the accuracy of the information in the publication or its appropriateness for any given purpose or situation. This publication shall not be construed as including, advice, guidance, or recommendations to take, or not to take, any actions or decisions regarding any matter, including without limitation relating to investments or the purchase or sale of any securities, shares or other assets of any kind. Should you take any such action or decision; you do so at your own risk. Information on the topics covered by this publication may be available from other sources, which the user may wish to consult for additional views or information not covered by this publication.
Copyright © 2024 American Gas Association. All rights reserved.