Natural Gas Market Indicators – May 30, 2024
Natural Gas Market Summary
NOAA’s 2024 Atlantic Hurricane Season Forecast predicts an above-normal season, expecting 17-25 named storms, 8-13 hurricanes, and 4-7 major hurricanes, with peak activity between August and October. La Niña conditions are anticipated to increase the likelihood of intense hurricanes. Meanwhile, FERC’s Summer Energy Market and Electric Reliability Assessment, released on May 23, forecasts warmer temperatures than the summer of 2023 based on NOAA data, anticipating temperatures to be 70 percent above normal for June, July, and August. FERC forecasts that overall natural gas demand of 96.7 Bcf per day, a 1.7 percent rise from last summer. Despite growing natural gas demand, gas demand for electric generation will remain at 45 percent of total demand. LNG exports are projected to increase by 11 percent, representing the highest year-over-year summer demand growth. FERC also highlights potential impacts on hydropower due to abnormally dry conditions, which may increase reliance on natural gas for electricity generation in the West.
Reported Prices
As trading for June contracts officially comes to a close, July futures at Henry Hub are trading at roughly $2.60 per MMBtu as of May 31. Futures remain above $2.00 per MMBtu through October and then rise to roughly $3.10 per MMBtu in November of 2024, remaining above $3,00 per MMBtu through November of 2025.
Weather
For the week ending in May 25, the weather was 85 percent warmer than last year as measured by cooling degree days. From the West coast to the South, temperatures are expected to be above average for the next two weeks. In the Northeast to the Great Lakes, temperatrues are expected to be below average.
In their 2024 Atlantic Hurricane Season Forecast, NOAA predicted that an above-normal season is very likely, with a confidence level of 85 percent. NOAA forecasts 17-25 named storms, 8-13 hurricanes, 4-7 major hurricanes, and an accumulated cyclone energy of 150 –245 percent of the median. NOAA claims a 70 percent probability for each of the ranges. While the Atlantic hurricane season is between June 1 and November 30, NOAA predicts that peak activity will be between August and October. The hurricane outlook is based on climate conditions and their influence on seasonal activity. La Niña conditions are favored through the summer and fall, increasing the likelihood of intense hurricanes.
Demand
The Federal Energy Regulatory Commission (FERC) released its Summer Energy Market and Electric Reliability Assessment on May 23 with notable findings regarding warmer weather, electric reliability, and increased natural gas demand. FERC notes that temperatures are anticipated to be warmer than in the summer of 2023, referencing NOAA’s forecasting temperatures to be roughly 70 percent above normal for June, July, and August. The higher temperatures are expected to drive electricity demand for cooling. Demand for natural gas is also expected to rise to 96.7 Bcf per day, roughly 1.7 percent above the same period last summer, continuing the trend of growing demand for natural gas. Although natural gas demand is forecasted to grow, natural gas consumption for electric generation is expected to decline only slightly this summer, a 0.1% drop from 45.7% in Summer of 2023 to 44.5% for Summer 2024. LNG exports are expected to increase 11 percent from last summer, representing the highest year-over-year summer demand growth and constituting 14 percent of total demand for summer 2024. Given the “abnormally dry conditions” across 39 percent of the U.S., FERC discusses the potential impact on hydropower due to the lack of rainfall and how this could increase reliance on natural gas for electricity generation in the West to meet cooling loads.
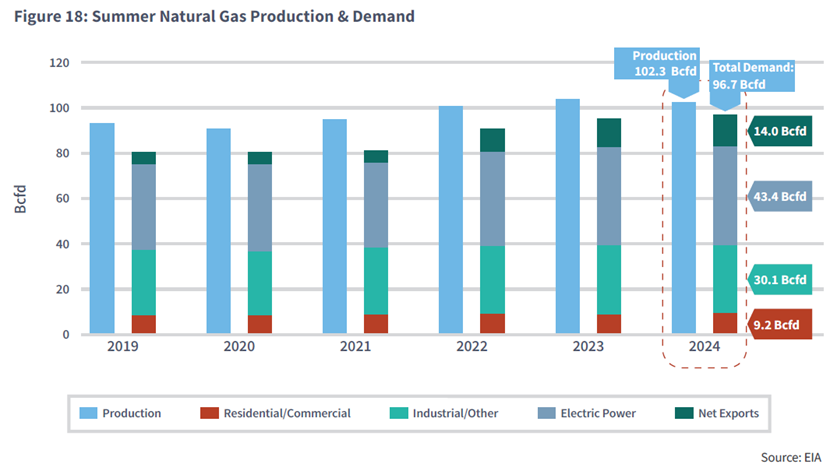
Chart: FERC
Total U.S. consumption fell only 0.4 Bcf per day week-over-week from 66.3 to 65.9 Bcf per day for the week ending May 22, as reported by the EIA. The decline was the result of the 2.9 Bcf per day drop in demand in the residential and commercial sectors, which was counterbalanced by a 2.8 Bcf per day rise in demand from power generation as temperatures rose across the country.
Production
The EIA reports a steady 99.1 Bcf per day in production for the week ending May 22, showcasing no change from week-ago production levels. Although there is no change week-over-week, production is down an average of 3.4 Bcf per day from 102.5 Bcf per day production one year ago. The decline in production comes amid lower commodity prices and higher-than-average storage levels.
LNG Markets
Natural gas deliveries to U.S. LNG export terminals increased only marginally week-over-week, climbing less than 0.1 Bcf per day from 12.7 to 12.8 Bcf per day for the week ending May 22, according to the EIA Natural Gas Weekly Update. Additionally, twenty-three LNG vessels with a combined carrying capacity of 84 Bcf departed the U.S. between May 16 and May 22.
International prices increased for the week ending May 22. Futures out of JKM rose $1.04 per MMBtu from $10.46 to $11.50 per MMBtu, $1.77 higher than prices year-over-year. Futures out of TTF experienced only a marginal increase of $0.69 from $9.51 to a weekly average of $10.20 per MMBtu.
Working Gas in Underground Storage
Net injections into underground storage were up 78 Bcf for the week ending May 17, bringing total working stocks to 2,711 Bcf according to the EIA’s Natural Gas Storage Dashboard. The reported underground storage levels are 29 percent, or 606 Bcf, higher than the five-year average and 17 percent higher year-over-year. Beginning the refill season with stocks higher than both the five-year average and five-year range may explain why this report week’s injection is 19 Bcf less than the injection one year ago and 14 Bcf less than the five-year average.
Pipeline Imports and Exports
Imports from Canada have increased an average of 0.4 Bcf per day from 5.3 to 5.7 Bcf per day for the week ending on May 22. Exports to Mexico have decreased by 0.5 percent, resulting in a daily average decline of less than 0.1 Bcf per day from last week’s daily average of 6.8 Bcf per day.
Rig Count
Baker Hughes reports a total of 600 rigs for the week ending May 24, a week-over-week decrease of 4 rigs. There was no change in oil-directed rigs from last week, attributing the total weekly decline to decreases in gas-directed rigs. The total of 600 rigs represents a 111-rig decline from May 2023.
For questions please contact Juan Alvarado | jalvarado@aga.org or Morgan Hoy | mhoy@aga.org
To be added to the distribution list for this report, please notify Lucy Castaneda-Land | lcastaneda-land@aga.org
NOTICE
In issuing and making this publication available, AGA is not undertaking to render professional or other services for or on behalf of any person or entity. Nor is AGA undertaking to perform any duty owed by any person or entity to someone else. Anyone using this document should rely on his or her own independent judgment or, as appropriate, seek the advice of a competent professional in determining the exercise of reasonable care in any given circumstances. The statements in this publication are for general information and represent an unaudited compilation of statistical information that could contain coding or processing errors. AGA makes no warranties, express or implied, nor representations about the accuracy of the information in the publication or its appropriateness for any given purpose or situation. This publication shall not be construed as including, advice, guidance, or recommendations to take, or not to take, any actions or decisions regarding any matter, including without limitation relating to investments or the purchase or sale of any securities, shares or other assets of any kind. Should you take any such action or decision; you do so at your own risk. Information on the topics covered by this publication may be available from other sources, which the user may wish to consult for additional views or information not covered by this publication.
Copyright © 2024 American Gas Association. All rights reserved.