Natural Gas Market Indicators -November 21, 2024
Natural Gas Market Summary
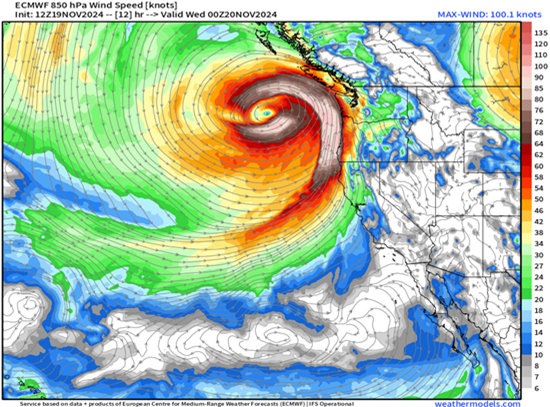
Colder-than-normal temperatures in the Pacific Region contributed to a “once in a decade” bombogenesis (or bomb cyclone) with hurricane-force winds that hit the Northwestern U.S. and parts of western Canada early Wednesday morning, according to CNN. The cyclone left at least two people dead and more than 800,000 customers without power in the immediate aftermath in Washington, British Columbia, and California. While the market impacts from the storm have yet to unfold, Weather Trader is expecting a second extratropical cyclone to follow.

In the Central, Southern, and Eastern States, the streak of relatively warmer weather may be coming to an end as weather forecasts predict the first winter weather event of the 2024-2025 winter heating season. According to the Weather Channel, a cold front is expected to move through these regions into the weekend. Temperatures are expected to fall into the low 30s in parts of the South, Midwest, and interior Northeast, with the potential for snowfall in North Dakota. This shift signals colder-than-normal conditions across much of the continental U.S. and Alaska, lasting into early December. As temperatures drop, natural gas demand is poised to rise, setting the stage for potential upward price movements. Additionally, supply constraints in the European and Asian markets could translate into increased demand for U.S. LNG exports in the short term, bolstering the potential for a bullish price outlook.
Reported Prices: A Market on the Move
CME reported that December 2024 Henry Hub futures settled at $3.19 per MMBtu on November 20, nearly 20 percent higher than the November 1 settlement. The seven-day moving average of Henry Hub futures was $2.95 per MMBtu at Wednesday’s close. Spot market activity echoed this sentiment, with Henry Hub prices increasing nearly 17 percent week-over-week to $2.10 per MMBtu on November 13. Regionally spot prices for the week varied:
- Northwest Sumas Hub: prices fell $0.72 per MMBtu to $0.96 per MMBtu
- Waha Hub: prices rose by $1.63 per MMBtu but remained in negative territory due to local market dynamics
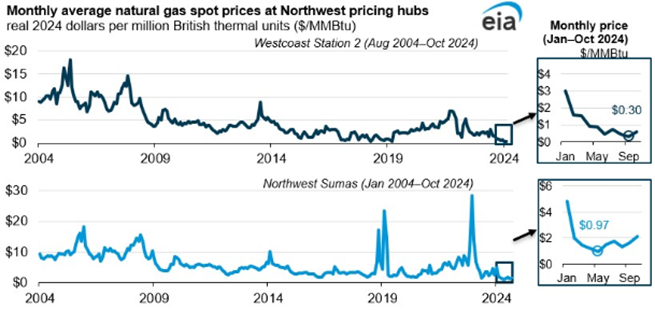
Spot prices at Northwest Sumas are at historic lows according to the EIA. Through October 2024, the monthly average price was $1.87 per MMBtu. Similarly, spot prices at Westcoast Station 2 averaged $1.03 per MMBtu through October 2024, with a record low of $0.31 per MMBtu on average in September.

Weather: Colder Forecast Signals Shifting Patterns
Weather across the U.S. has been mild for most of November, with temperatures 5 percent warmer than last year and 21 percent warmer than the 30-year normal, based on heating degree day data from November 3 through November 16. However, the pattern is changing as a cold La Niña event develops in the Pacific Ocean. This phenomenon is driving colder temperatures and winter storms from the polar regions into the northern and northwestern U.S. into Saturday and Sunday.
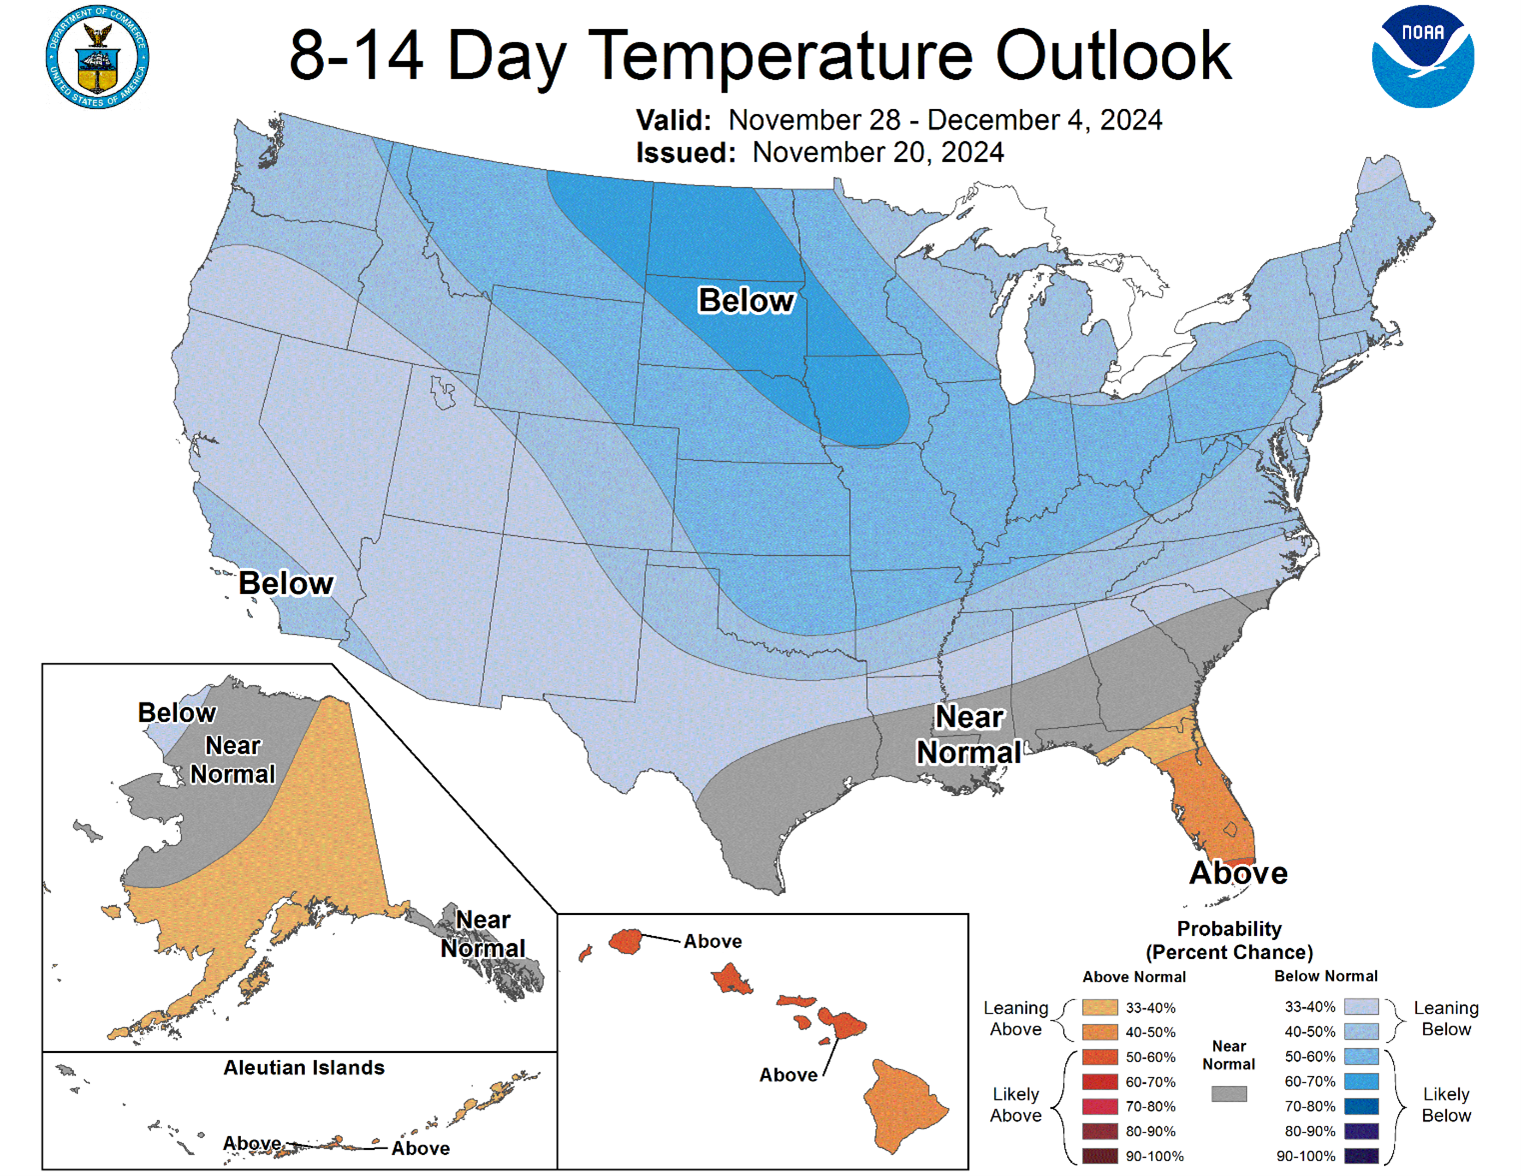
From Thanksgiving day into early December, the National Oceanic and Atmospheric Administration (NOAA) predicts below-normal temperatures across most of the continental U.S. with the potential for above average temperatures in parts of Florida, Alaska, and Hawaii. These conditions may affect residential heating demand and tighten the supply-demand balance in the short term.

The Atlantic is expected to have a much-needed reprieve from hurricanes and tropical storms, with no tropical activity expected as of the time of this writing. Similarly, NOAA’s National Hurricane Center had not reported any disturbances in the Central or Eastern Pacific as of Tuesday.
Demand: Residential and Commerical Load Begins Shift into Winter Season
Natural gas consumption rose by 5 percent (3.8 Bcf per day) for the week ending November 13, according to the EIA. The residential and commercial sectors led the increase, with consumption jumping 24 percent (4.3 Bcf per day) week-over-week. Industrial demand ticked up slightly by 0.3 Bcf per day.
Year-over-year trends:
- Power sector demand rose 5.9 percent
- Residential and commercial demand is down 5.9 percent
- Industrial demand is down 3.7 percent
Production: Associated Gas Balances the Market
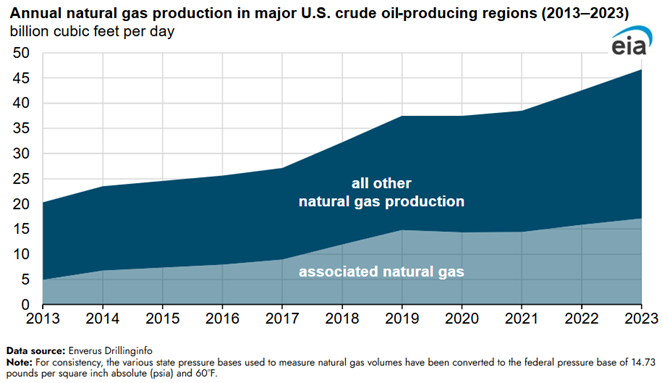
Dry natural gas production averaged 100.9 Bcf per day for the week ending November 13, falling 0.9 percent below production averages for the prior week and 3.7 percent below the same period last year, according to the EIA. However, the EIA also reported that associated natural gas production in the U.S. increased by 7.9 percent year-over-year in 2023, averaging 17.1 Bcf per day.

LNG Markets: Export Activity Increase
U.S. LNG exports are ramping up in response to global demand as Europe plans for a cooler winter after two years of mild winter weather. The Oxford Institute for Energy Studies reported that supply shortages from U.K. production and the planned discontinuance of Russian gas supply through Ukraine will require increased LNG imports in coming months.
For the week ending November 13, the EIA reported:
- A total of 26 LNG vessels departed, carrying 97 Bcf of combined capacity
- Average natural gas deliveries to U.S.-based LNG terminals rose 11 percent (1.4 Bcf per day) to 14.1 Bcf per day
Working Gas in Underground Storage: Export Activity Increase
The EIA reports net withdrawals of 3 Bcf for the week ending November 15, lowering total stocks to 3,969 Bcf. This was the first net withdrawal from storage inventories in 13 weeks. However, working gas stock remains robust, sitting at 16 Bcf above the 5-year maximum. While this surplus could apply downward price pressure, colder weather forecasts are likely to offset such movement.
Pipeline Imports and Exports:Winter- Ready -Reserves
Net Canadian imports rose 9.6 percent (0.6 Bcf per day) week-over-week according to the EIA. Since the week ending October 30, imports from Canada have increased a net 1.1 Bcf, supported by strong production at the Western Canadian Sedimentary Basin and high Canadian storage inventories. In August, Canadian natural gas storage was 37 percent above the five-year average. The EIA attributes the historic low gas prices in western Canada and northwestern U.S. hubs for 2024 year-to-date to this higher production activity and storage inventory. Meanwhile, U.S. exports to Mexico for the week ending November 13 rose 4.8 percent (0.3 Bcf per day) from the week prior.
Rig Count: Regional Dynamics
According to Baker Hughes, the natural gas rig count held steady at 102 for the week ending November 5, a 13.6 percent decline compared to last year. Oil-directed rigs also remained unchanged at 479, down 3 percent from last year.
What to Watch: Key Market Drivers
- Weather: Will the cold snap persist into mid-December, further driving demand?
- Storage: How will inventory levels interact with increasing consumption?
- LNG Exports: An increase in European demand could place upward pressure on prices.
For questions please contact Juan Alvarado | jalvarado@aga.org, Liz Pardue| lpardue@aga.org, or Lauren Scott | lscott@aga.org
To be added to the distribution list for this report, please notify Lucy Castaneda-Land | lcastaneda-land@aga.org
NOTICE
In issuing and making this publication available, AGA is not undertaking to render professional or other services for or on behalf of any person or entity. Nor is AGA undertaking to perform any duty owed by any person or entity to someone else. Anyone using this document should rely on his or her own independent judgment or, as appropriate, seek the advice of a competent professional in determining the exercise of reasonable care in any given circumstances. The statements in this publication are for general information and represent an unaudited compilation of statistical information that could contain coding or processing errors. AGA makes no warranties, express or implied, nor representations about the accuracy of the information in the publication or its appropriateness for any given purpose or situation. This publication shall not be construed as including, advice, guidance, or recommendations to take, or not to take, any actions or decisions regarding any matter, including without limitation relating to investments or the purchase or sale of any securities, shares or other assets of any kind. Should you take any such action or decision; you do so at your own risk. Information on the topics covered by this publication may be available from other sources, which the user may wish to consult for additional views or information not covered by this publication.
Copyright © 2024 American Gas Association. All rights reserved.Natural Gas Market Indicators – September 12, 2024