Natural Gas Market Indicators -October 10, 2024
Natural Gas Market Summary
As of this publication, Hurricane Milton made landfall as a major hurricane Wednesday evening, bringing dangerous storm surges and destructive winds to Florida. Given the storm’s size and intensity, the potential impacts on homes and businesses could be catastrophic. Energy markets are likely to reflect these disruptions, as evacuations ahead of the storm and power outages resulting from the storm itself will impact demand and infrastructure. Following the widespread effects of Hurricane Helene and now the anticipated impacts of Hurricane Milton, the Market Indicators team wishes for the safety and well-being of those impacted by these storms.
Reported Prices
Warmer-than-normal weather expectations for the month of October are alleviating price pressures on natural gas ahead of a possibly colder-than-normal winter. S&P Connect reports that anticipated warmer weather has slowed seasonal increases in residential and commercial demand for natural gas used for power generation, resulting in softening natural gas futures. The October 2024 NYMEX contract expired at $2.89 per MMBtu on September 26, according to EIA. CME reports that November Henry Hub futures settled at $2.66 per MMBtu on October 9. This represents an 8 percent decrease from the first of the month settlement of $2.90 per MMBtu.
In the longer term, prices are looking more bullish. The National Gas Supply Association’s winter outlook published on October 3 predicts that a colder-than-normal winter will increase residential and commercial demand by 14 percent and industrial demand by 7 percent compared to last winter, placing upward pressure on prices. FX Empire echoed this sentiment, noting that LNG sales are expected to rise by 50 percent into 2030 according to TotalEnergies SE. This juxtaposition of market influences could indicate pricing fluidity as the U.S. enters the 2024-2025 winter heating season.
Weather
For the week ending October 5, U.S. temperatures were 9.7 percent warmer than last year and 61.9 percent warmer than the 30-year normal. All regions were cooler than last year except the South Atlantic, Mountain, and Pacific regions, while all regions except the New England and Middle Atlantic regions were warmer than normal.
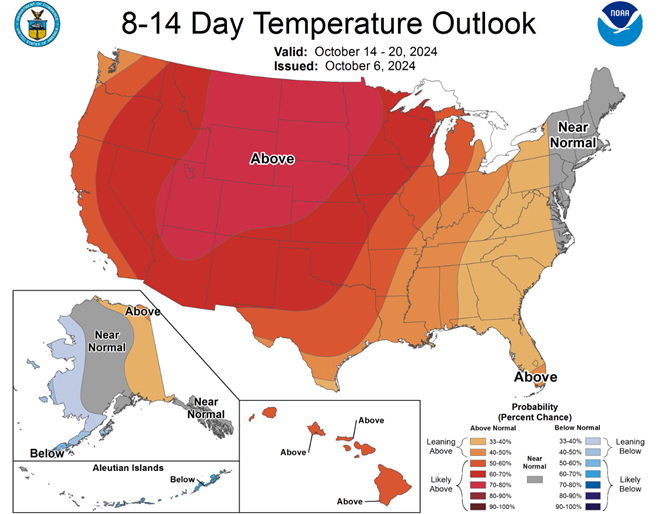
For mid-October, the temperature outlook for the U.S. is largely above normal with a portion of the Northeast expected to be near normal, according to the National Weather Service Climate Prediction Center. In contrast, portions of Alaska and the Aleutian Islands are expected to be below normal during this period.
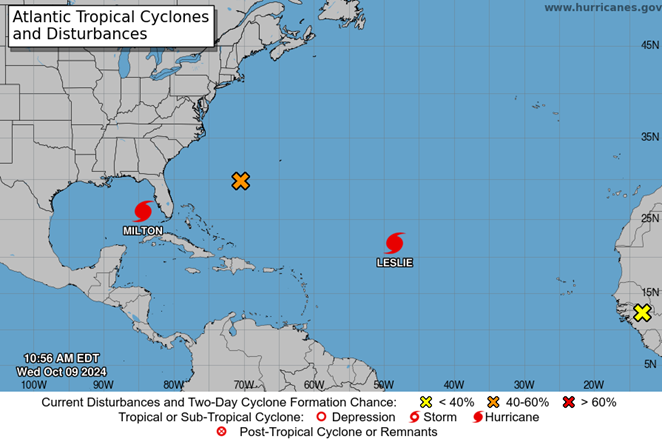
In both the Gulf of Mexico and the Atlantic, hurricane season continues while many communities in the southeast are still reeling from Hurricane Helene. In the Gulf, Hurricane Milton strengthened Monday into a Category 5 hurricane and made landfall as a major storm on the western coast of the Florida peninsula Wednesday evening. As of Wednesday morning, the National Hurricane Center (NHC) of the National Oceanic and Atmospheric Administration (NOAA) issued watches and warnings along the coastal regions of Florida, Georgia, and South Carolina. In the Atlantic, NHC reports that Hurricane Leslie has strengthened, but no watches or warnings are in effect at this time. The NHC is also monitoring two disturbances in the Atlantic and one in the Eastern Pacific.
Demand
According to the EIA, total U.S. natural gas consumption decreased by 3.1 percent, or 2.3 Bcf per day, for the week ending October 2, driven largely by lower consumption in the power sector. Power sector consumption fell by 2.8 Bcf per day from the prior week but was up 1.5 Bcf per day from the same period last year. The residential/commercial and industrial sectors posted consumption gains of 0.2 Bcf per day each over the previous week. Year-over-year, these sectors are up 0.2 Bcf per day and 0.1 Bcf per day, respectively.
Production
The EIA reports dry gas production of 101.7 Bcf per day for the week ending October 2, a 0.5 Bcf per day increase from the previous week. Production also lagged compared to the same period last year by 1.1 Bcf per day, a decrease of 1 percent.
LNG Markets
For the week ending October 2, natural gas deliveries to LNG export terminals decreased 0.2 Bcf per day to 12.4 Bcf per day from the week prior, according to the EIA. A total of 25 vessels with a combined carrying capacity of 94 Bcf departed from the U.S. between September 26 and October 2.
Working Gas in Underground Storage
The EIA reports that net injections into underground storage totaled 82 Bcf for the week ending October 4, 124 Bcf (3.5 percent) higher than the same week last year. Total working natural gas stocks of 3,629 Bcf for the week are 5.1 percent (176 Bcf) higher than the five-year average.
Pipeline Imports and Exports
For the week ending October 2, the EIA reports net Canadian imports fell 0.2 Bcf per day (3.5 percent) relative to the prior week but exceeded the same period last year by 0.4 Bcf per day. U.S. exports to Mexico likewise fell 3.5 percent (0.2 Bcf per day) week-over-week after increasing 4.3 percent (0.3 Bcf per day) for the week ending September 25.
Rig Count
According to Baker Hughes, the total natural gas rig count across the U.S. increased to 99 for the week ending September 24, an increase of three rigs from the previous week. The number of oil-directed rigs decreased to 484, a 0.8 percent change relative to last week. In total, 587 rigs are in operation across the U.S., down 36 rigs from the year prior.
For questions please contact Juan Alvarado | jalvarado@aga.org, Liz Pardue| lpardue@aga.org, or Lauren Scott | lscott@aga.org
To be added to the distribution list for this report, please notify Lucy Castaneda-Land | lcastaneda-land@aga.org
NOTICE
In issuing and making this publication available, AGA is not undertaking to render professional or other services for or on behalf of any person or entity. Nor is AGA undertaking to perform any duty owed by any person or entity to someone else. Anyone using this document should rely on his or her own independent judgment or, as appropriate, seek the advice of a competent professional in determining the exercise of reasonable care in any given circumstances. The statements in this publication are for general information and represent an unaudited compilation of statistical information that could contain coding or processing errors. AGA makes no warranties, express or implied, nor representations about the accuracy of the information in the publication or its appropriateness for any given purpose or situation. This publication shall not be construed as including, advice, guidance, or recommendations to take, or not to take, any actions or decisions regarding any matter, including without limitation relating to investments or the purchase or sale of any securities, shares or other assets of any kind. Should you take any such action or decision; you do so at your own risk. Information on the topics covered by this publication may be available from other sources, which the user may wish to consult for additional views or information not covered by this publication.
Copyright © 2024 American Gas Association. All rights reserved.Natural Gas Market Indicators – September 12, 2024