Natural Gas Market Indicators – September 12, 2024
Natural Gas Market Summary
Natural gas is beginning to flow through the Matterhorn Express Pipeline, which connects Katy, Texas to the Permian Basin. Later this month, the pipeline, which has a capacity of 2.5 Bcf per day, will be the first of four new Permian Basin pipeline projects to enter service, according to EIA. However, the new pipeline’s service date could be clouded by Hurricane Francine, which made landfall on the Louisiana coast as a Category 2 storm on September 11. In preparation for the storm, producers had evacuated 130 offshore platforms and shut-in 27 percent of Gulf of Mexico natural gas production as of September 10.
In the LNG market, Francine may halt operations along the Gulf for large-exporting facilities such as Freeport LNG, as operators have reported beginning storm preparations. Energy Connects reports that facilities in the storm’s path account for an estimated 300 MMcf per day. Francine’s ultimate impact on natural gas markets remains to be seen as the storm develops. FX Empire attributes rising futures prices to conflicting weather reports and the storm’s potential impact. Despite market uncertainty, futures prices remain resistant to significant increases due to high storage levels and steady production.
Reported Prices
October Henry Hub futures settled at $2.27 per MMBtu on September 11, according to CME. Regionally, natural gas spot prices rose at all major pricing locations for the week ending September 4. The EIA reports that price increases ranged from $0.14 per MMBtu at FGT Citygate in Florida to $3.57 at Waha Hub in West Texas.
Weather
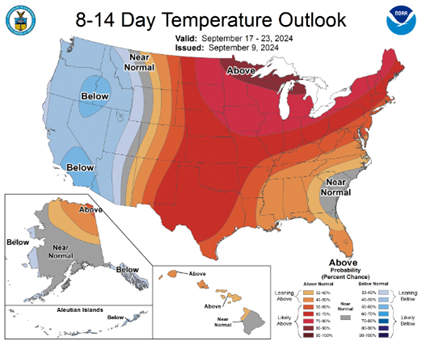
A hot August for the country has cooled for the eastern half of the United States. Weather in the U.S. was 9 percent warmer than normal for August, although temperatures as measured by cooling degree days (CCDs) were 0.9 percent cooler than last year. For the week ending September 7, U.S. temperatures were 21.9 percent cooler than last year but still 4.2 percent warmer than the 30-year normal, driven in part by hot temperatures in the western U.S. The Pacific census division reported 119 percent higher CDDs compared to the 30-year for the week ending September 7, 2024; the Mountain region was 29 percent warmer.
Across the Midwest, Northeast, and much of the South, temperatures are forecasted to be above normal in mid-September, according to the National Weather Service Climate Prediction Center. Conversely, much of the West is expected to experience below-normal temperatures.
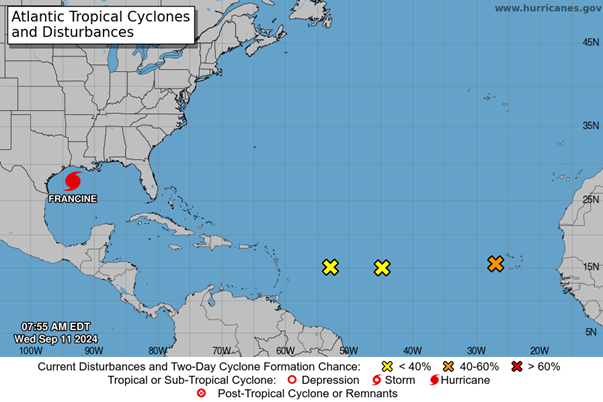
In the Gulf of Mexico, Hurricane Francine gained strength early in the week, upgrading from a tropical storm to Category 2 hurricane ahead of making landfall. Louisiana, Alabama, and Mississippi are currently experiencing flooding and widespread power outages, according to Axios. The National Oceanic and Atmosphiric Administration issued advisories on September 11 about the storm and noted three other disturbances further out in the Atlantic at that time.
Demand
The EIA reports total U.S. natural gas consumption decreased by 3.8 percent, or 2.9 Bcf per day, for the week ending September 4. In the power sector, consumption softened by 5.4 percent (0.1 Bcf per day), while consumption in the residential and commercial sectors fell by 6.2 percent (0.5 Bcf per day). Industrial sector consumption increased a modest 0.3 percent. As of September 10, natural gas demand for electric generation increased by 236 MMcf per day, according to S&P Global Commodity Insights, driven primarily by increasing demand in the Northeast.
Production
The Bureau of Safety and Environmental Enforcement (BSEE) reports that personnel from 130 offshore platforms have been evacuated in response to Francine, representing 35 percent of operating platforms as of September 10. BSEE estimates that 27 percent of current natural gas production, or 494 MMcf per day, has been shut in from the Gulf of Mexico. Additionally, 24 percent of oil production, or 412,070 barrels per day, has been shut-in. The EIA reports dry gas production of 101.6 Bcf per day for the week ending September 4, a 0.4 Bcf per day decrease from the week prior. This represents a decrease of 2.1 percent compared to last year.
LNG Markets
For the week ending September 4, natural gas deliveries to LNG export terminals increased 0.4 Bcf per day to 13.2 Bcf per day from the previous week, according to the EIA. A total of 25 vessels with a combined carrying capacity of 94 Bcf of LNG departed from the U.S. between August 29 and September 4.
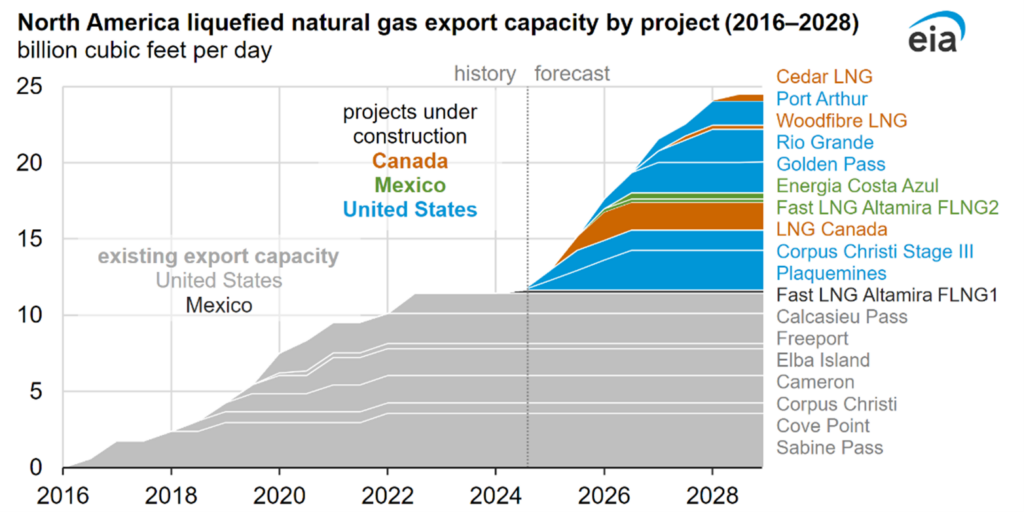
The EIA also reports that total LNG export capacity in North America is on track to more than double by 2028, from 11.4 Bcf per day in 2023 to 24.4 Bcf per day in 2028. With ten new projects under construction, export capacity will grow by 0.8 Bcf per day in Mexico, 2.5 Bcf per day in Canada, and 9.7 Bcf per day in the U.S. However, market demand is also necessary to see full utilization of this liquefaction capacity. According to Reuter’s, the U.S. shipped nearly 57 million metric tons of LNG from January through August 2024. During that eight-month period, U.S. exports to Europe fell 22 percent compared to the same period last year due to declining European natural gas demand.
Working Gas in Underground Storage
The EIA reports that net injections into underground storage were 13 Bcf for the week ending August 30, a 75 percent decrease from the five-year average of 51 Bcf. Storage levels remain high across the U.S. with weekly working gas stocks totaling 3,347 Bcf in the Lower-48. This is 11 percent higher than the five-year average and 7 percent higher than last year.
Pipeline Imports and Exports
For the week ending September 4, the EIA reports imports from Canada decreased week over week by 0.3 Bcf per day, or 4.5 percent, but is up year over year by 14.3 percent. Exports to Mexico increased by 0.2 Bcf per day or 3.3 percent week over week.
Rig Count
According to Baker Hughes, there were 583 rigs in operation across the U.S. for the week ending August 27, a 7.6 percent decrease year over year. Compared to the previous week, the number of natural gas rigs decreased by two to 95, while the number of oil-directed rigs remained flat at 483.
For questions please contact Juan Alvarado | jalvarado@aga.org, Liz Pardue| lpardue@aga.org, or Lauren Scott | lscott@aga.org
To be added to the distribution list for this report, please notify Lucy Castaneda-Land | lcastaneda-land@aga.org
NOTICE
In issuing and making this publication available, AGA is not undertaking to render professional or other services for or on behalf of any person or entity. Nor is AGA undertaking to perform any duty owed by any person or entity to someone else. Anyone using this document should rely on his or her own independent judgment or, as appropriate, seek the advice of a competent professional in determining the exercise of reasonable care in any given circumstances. The statements in this publication are for general information and represent an unaudited compilation of statistical information that could contain coding or processing errors. AGA makes no warranties, express or implied, nor representations about the accuracy of the information in the publication or its appropriateness for any given purpose or situation. This publication shall not be construed as including, advice, guidance, or recommendations to take, or not to take, any actions or decisions regarding any matter, including without limitation relating to investments or the purchase or sale of any securities, shares or other assets of any kind. Should you take any such action or decision; you do so at your own risk. Information on the topics covered by this publication may be available from other sources, which the user may wish to consult for additional views or information not covered by this publication.
Copyright © 2024 American Gas Association. All rights reserved.Natural Gas Market Indicators – September 12, 2024