Natural Gas Market Indicators -December 5, 2024
Natural Gas Market Summary
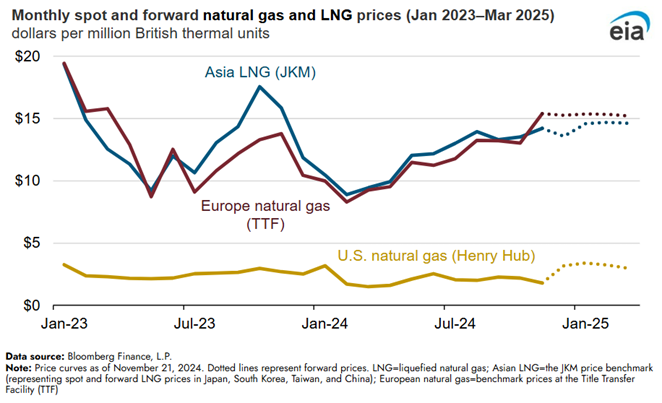
According to the EIA, the natural gas supply-demand balance this winter could be affected by supply disruptions in Europe due to the Russia-Ukraine gas transit contract that may expire at the end of the year, anticipated limited capacity growth in LNG supply, and the possibility of colder-than-normal temperatures, potentially contributing to a tightening gas market in early 2025. As we move into the winter heating season, these factors could contribute to bullish natural gas pricing sentiment. In its November 2024 Short-Term Energy Outlook, the EIA projects Henry Hub spot prices will average $2.68 per MMBtu over the winter heating season, with a potential monthly average price as high as $3.10 per MMBtu in January 2025.
This bullish sentiment could be offset if warmer than anticipated weather reduced projected draw-downs of natural gas inventories. Due in part to warmer than average weather for much of the U.S. throughout November, storage inventories reached 3,972 for the week ending November 8. As of the week ending November 22, inventories had fallen 2 Bcf relative to the prior week, but were 3.5 percent higher year over year and 7.2 percent higher than the five-year average. With warmer-than-normal weather anticipated into mid-December and production near 2023 levels, prices could trend lower in the short term.
Futures Higher as Winter Heating Season Begins
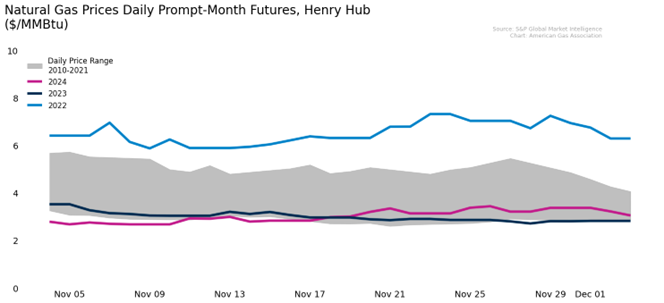
December 2024 Henry Hub futures closed at $3.43 per MMBtu on November 26, according to CME. January contracts are trading lower, settling at $3.04 per MMBtu on December 4. However, prices have generally trended upward since mid-October, settling 34.8 percent ($0.79 per MMBtu) higher on December 4. S&P Global Market Intelligence data shows that for the month of November, prompt month futures at Henry Hub:
- Averaged prices 2.4 percent lower than last year
- Increased 15.7 percent over average October prices
Winter Weather Continues in the Northern Midwest, Northeast
For the week ending November 30, weather in the U.S. was 12.7 percent warmer than last year and 0.8 percent colder than the 30-year normal. Except for the East North Central, West North Central, and East South Central regions, all regions experienced warmer temperatures for the week.
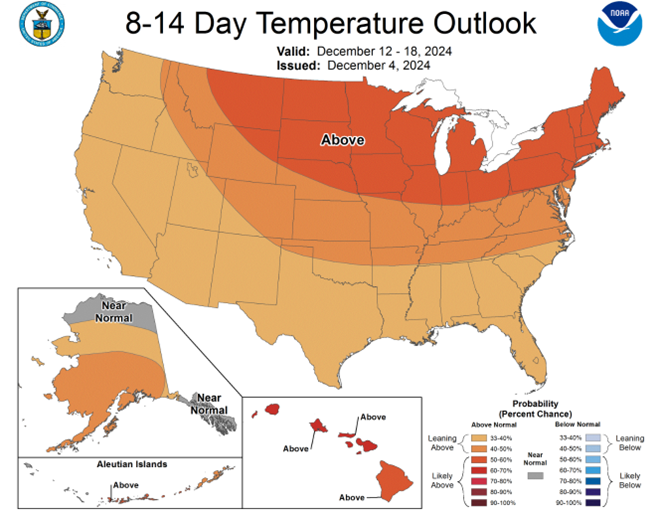
After the first showing of winter weather following the Thanksgiving holiday in much of the northern and northeastern U.S., the National Oceanic and Atmospheric Administration is projecting above-normal temperatures for most of the U.S. in mid-December with portions of Alaska likely to experience temperatures near normal. In the near term, however, lake-effect snow squalls and arctic air could impact portions of the Great Lakes and Northeast into the weekend, according to a USA Today report. The National Weather Service issued a short-range forecast into Saturday for moderate to heavy lake-effect snow in parts of New England and temperatures 10 to 20 degrees below average in parts of the Ohio Valley and Mid-Atlantic.
Residential and Commercial Sectors Driving Demand Growth
Natural gas consumption rose by 5.9 percent for the week ending November 29, according to data from S&P Global Intelligence. The residential and commercial sectors led the increase, with consumption jumping 22.5 percent week-over-week. Industrial demand increased slightly by 1.1 percent while power demand fell by 1.7 percent
Year-over-year trends:
- Residential and commercial demand is down 16.5 percent
- Industrial demand is down 4.8 percent
- Power sector demand fell 6.2 percent
Associated Gas Balances the Market Year-to-Date Production
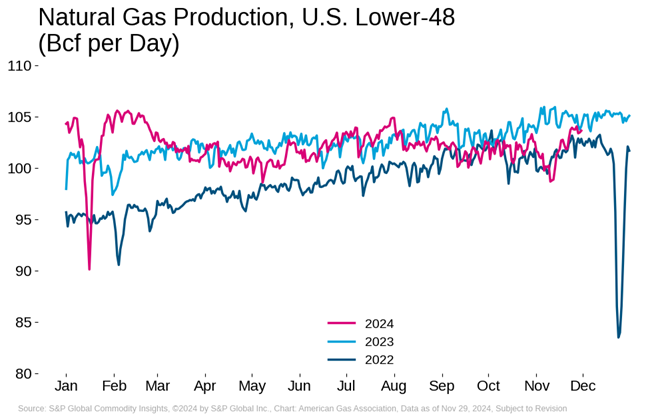
For the week ending November 29, dry natural gas production increased 1.1 percent over the week prior, according to S&P Global Commodity Insights. Compared to the same week last year, production is down 0.9 percent; however, recent trends indicate:
- Since on November 9, production has increased by 5 percent
- Production has recovered after falling 4.5 percent from October 28 to November 9, following Hurricane Raphael in the Gulf of Mexico
- Nearly 17 percent of natural gas output in the Gulf was offline in the aftermath of the storm
LNG Exports May Balance Global Supply Challenges
For the week ending November 29, natural gas deliveries to LNG terminals decreased by 0.11 percent, according to data from S&P Global Commodity Insights. This represents a 3.1 percent decrease year over year. This winter, the EIA expects that U.S. LNG exports will help to balance the global market, with exports averaging 13.7 Bcf per day, an 8 percent increase from last winter, due to new and expanded projects coming online. Domestically, a colder-than-normal winter could mean high storage withdrawals and lower inventory stocks, potentially applying upward pressure on prices, and the potential for operational issues and freeze-offs which could lower export volumes and affect LNG prices.
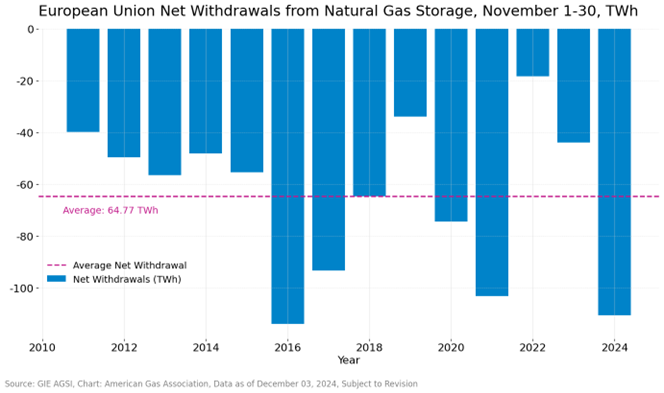
In the European Union, the market may already be tightening, with net withdrawals from storage in November exceeding the average from 2010 through 2024 and rivaling 2016 withdrawals, when temperatures were significantly colder than normal. Rueter’s reports that active restocking of rapidly-declining gas inventories in Europe and Asia will likely spur strong LNG demand, even if temperatures become mild again. Additionally, with prices climbing 30 to 50 percent in Asia, Europe and North America so far in 2024, strong international demand is likely to keep market sentiment bullish into 2025.
Highest Storage Inventories Entering Winter Since 2016
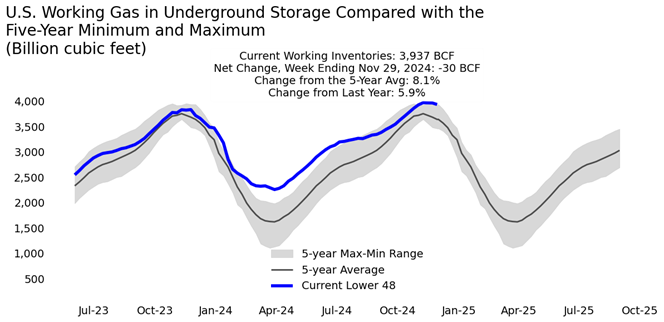
The EIA reports net withdrawals of 30 Bcf for the week ending November 29, reducing total stocks to 3,937 Bcf in the Lower 48. However, storage inventories remain robust at 8.1 percent higher than the 2019-2023 five-year average and 5.9 percent higher than the same week last year. EIA analysis indicates that storage inventories starting this winter were the highest recorded since 2016, despite below-average injections nearly every week during the 2024 injection season.
Stable North American Trade Flows
According to S&P Global Commodity Insights, net Canadian imports to the U.S. increased 1.4 percent and net exports to Mexico remained flat for the week ending November 29.
Natural Gas Rig Activity Sees Modest Uptick
Baker Hughes reports 100 natural gas rigs for the week ending November 27, a 1 percent increase over last week and 13.8 percent decline compared to last year. Oil-directed rigs decreased year-over-year by 5.5 percent.
What to Watch: Key Market Drivers
- Pricing: The potential for bullish price sentiment could sustain upward pressure on natural gas prices for the winter.
- Storage: Above-average inventories could act as a buffer against price volatility in the short term.
- Weather: A colder-than-normal winter could slow LNG exports, tightening domestic and global markets
For questions please contact Juan Alvarado | jalvarado@aga.org, Liz Pardue| lpardue@aga.org, or Lauren Scott | lscott@aga.org
To be added to the distribution list for this report, please notify Lucy Castaneda-Land | lcastaneda-land@aga.org
NOTICE
In issuing and making this publication available, AGA is not undertaking to render professional or other services for or on behalf of any person or entity. Nor is AGA undertaking to perform any duty owed by any person or entity to someone else. Anyone using this document should rely on his or her own independent judgment or, as appropriate, seek the advice of a competent professional in determining the exercise of reasonable care in any given circumstances. The statements in this publication are for general information and represent an unaudited compilation of statistical information that could contain coding or processing errors. AGA makes no warranties, express or implied, nor representations about the accuracy of the information in the publication or its appropriateness for any given purpose or situation. This publication shall not be construed as including, advice, guidance, or recommendations to take, or not to take, any actions or decisions regarding any matter, including without limitation relating to investments or the purchase or sale of any securities, shares or other assets of any kind. Should you take any such action or decision; you do so at your own risk. Information on the topics covered by this publication may be available from other sources, which the user may wish to consult for additional views or information not covered by this publication.
Copyright © 2024 American Gas Association. All rights reserved.Natural Gas Market Indicators – September 12, 2024