Special Edition: Natural Gas Market Indicators – January 9, 2025
Special Edition: Winter Storm Blair
Winter Storm Blair brought heavy snowfall, icy conditions, and frigid temperatures to much of the U.S. early in the New Year. The storm arrived in the Pacific Northwest on January 3, moving inland through the Rockies and dropping more than 20 inches of snow in parts of Utah, according to The Weather Channel. Through January 7, the storm moved further East, impacting states in the Midwest, Mid-Atlantic, and parts of the South. In Kansas and Missouri, blizzard conditions brought wind gusts up to 45 mph and temperatures as low as 0⁰F. In Maryland and Washington D.C., snowfall exceeded 5.5 inches, and some East Coast cities recorded the most snowfall in a single day in decades. Across many states, Blair halted travel, caused more than 350,000 power outages, and could be responsible for at least 10 deaths.
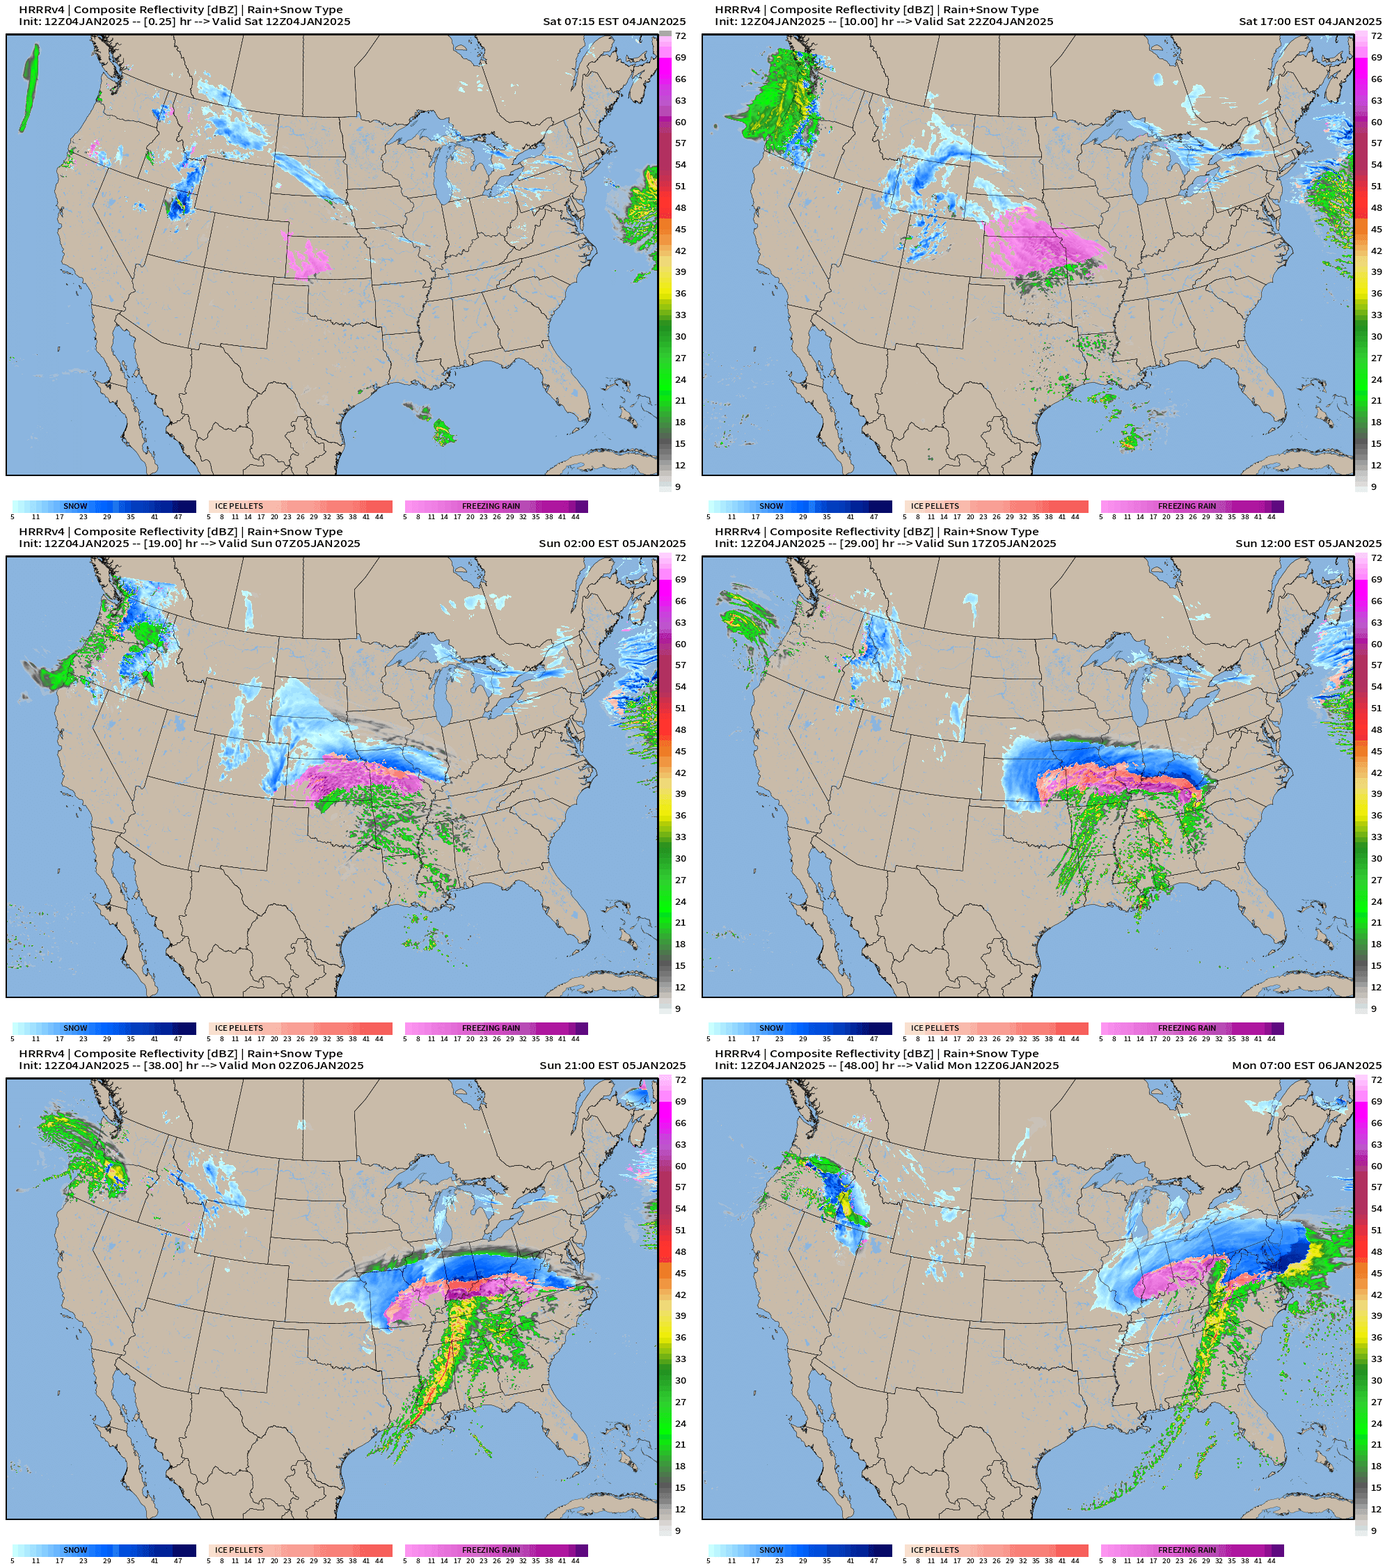
In Blair’s aftermath, temperatures are expected to remain at or below freezing in several areas around the U.S., while several states brace for Winter Storm Cora, which is already underway in the western half of Texas, bringing a mixture of snow, sleet, and freezing rain. Winter storm alerts have been issued across Texas, Oklahoma, Arkansas, Louisiana, Mississippi, and Tennessee, with The Weather Channel reporting Cora’s impact could reach the Carolinas as early as Friday. Additionally, meteorologists are monitoring the potential for an Atlantic bomb cyclone over the weekend.
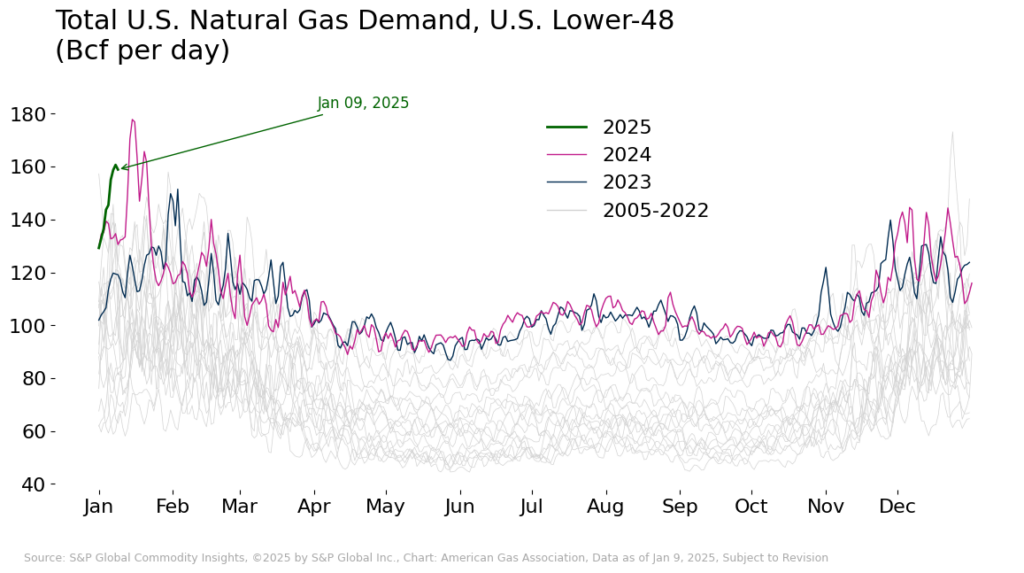
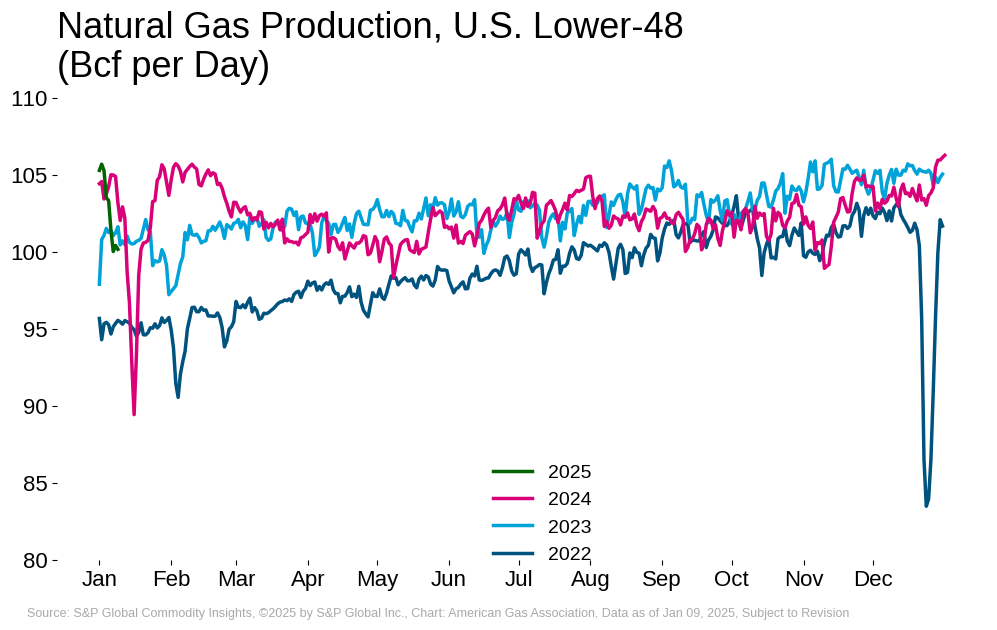
Coincident with the winter storm and declining temperatures, reported dry gas production fell 5.0 percent from levels reached at the beginning of the year based on data from S&P Global Commodity Insights. Production declines over this period were seen in the Southeast, Texas, Northeast, and Midwest regions. The chilly conditions heightened domestic demand, which increased by 18.4 percent between January 3 and January 7. Total natural gas demand, including exports, reached an estimated 160.7 Bcf on January 8, according to S&P Global Commodity Insights. Of note, natural gas demand in the power and residential/commercial sectors increased by 30.1 percent and 18.7 percent, respectively. Prior to Blair, storage inventories remained strong, experiencing a lower-than-expected drawdown of 40 Bcf for the week ending January 3. While the impact of Blair on stocks is still uncertain, the market may be tested further with another icy forecast ahead over the second and third weeks of January.
Futures Prices Trending Higher than Start of 2024
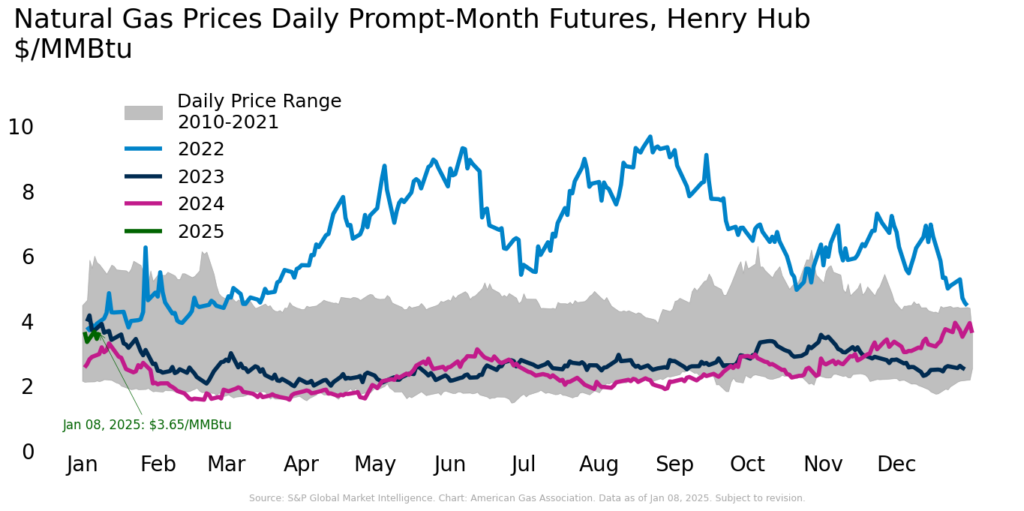
According to CME, prompt-month Henry Hub futures settled at $3.65 per MMBtu on January 8, down 0.2 percent from the first trading day in January. The market saw some price volatility intra-day on January 6, 7, and 8 as it grappled with the conflicting pressures brought on by fears of an extended cold snap and an EIA storage report showing lower-than-expected withdrawals. Compared to longer-term trends, data from S&P Global Market Intelligence indicates Henry Hub prompt-month prices for the first week of January 2025 are higher than the same period in 2024 but lag 2022 and 2023 levels.
Natural gas price highlights:
- Henry Hub spot price reached $4.05 per MMBtu on January 6, up nearly 20 percent over the prior week, according to NGI data
- Seven-day average prompt month price of $3.60/MMBtu as of January 7 is more than 33 percent higher than the seven-day average as of January 8, 2024
Consumption Soars Due to Winter Weather
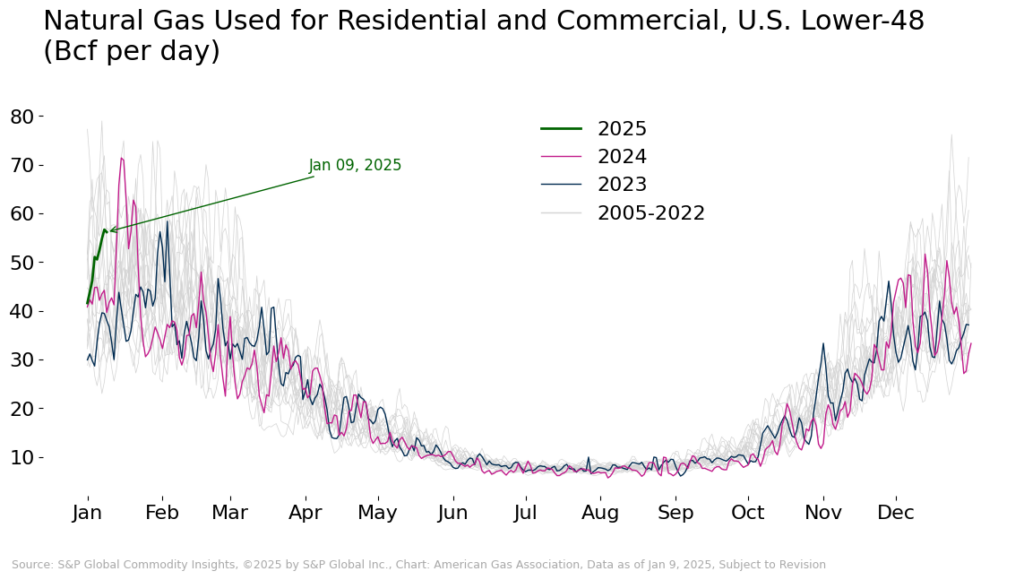
According to S&P Global Commodity Insights, average domestic natural gas consumption increased by 33 percent for the week ending January 9, largely driven by a 55 percent increase in residential and commercial sector consumption resulting, in part, from Winter Storm Blair. Over the same period, power sector demand rose by 28.6 percent, and industrial demand increased by 8.5 percent. Average daily LNG feedgas demand increased 0.9 percent week-over-week, and exports to Mexico increased 16.3 percent over the same period.
Between January 3 and 7:
- Total demand increased 18.4 percent
- Residential and commercial sector demand increased nearly 19 percent
- Industrial sector demand rose more than 3 percent
- Power sector demand increased more than 30 percent
Winter Weather Contributes to Lower Production
Weekly dry natural gas production fell 2.8 percent for the week ending January 9 compared with the week prior and 1.7 percent below the same week last year, according to data from S&P Global Commodity Insights, despite increasing demand. Between January 3 and 7, daily production fell 5.0 percent, dropping below 100 Bcf per day. Falling production levels may have resulted from regional well-head freeze-offs blocking or restricting the flow of gas. S&P Commodity Insights reports that the Texas natural gas production sample has already exhibited signs of freeze-offs, falling 12 percent on January 7 compared to the sample average for the week ending January 4. In January last year, freeze-offs reduced gas output by 16.5 Bcf per day during Winter Storm Heather, according to data from LSEG.
Regional Breakdown:
- Production fell in every region across the U.S. between January 3 and January 7
- The most notable regional declines occurred in Texas and the Southwest, which fell 9.4 percent and 6.7 percent, respectively
- Production also decreased 3.8 percent in the Northeast, 2.6 percent in the Midwest, and 2.3 percent in the Southeast
Storage Inventories Strong Ahead of Blair
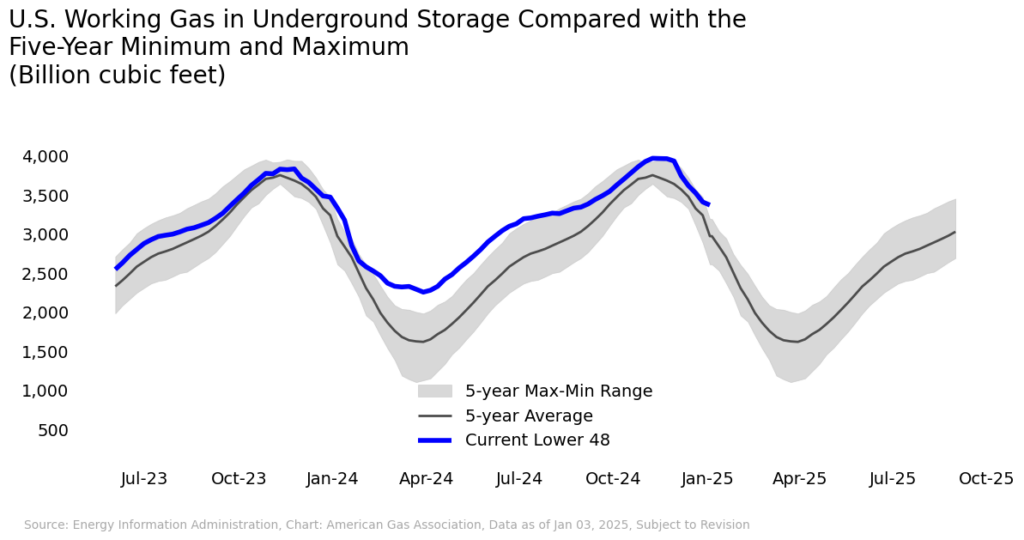
The EIA reports net withdrawals of 40 Bcf for the week ending January 3, reducing total working natural gas stocks to 3,373 Bcf in the Lower 48. Inventories were robust at the start of 2025, sitting just 3 Bcf below the five-year maximum and 207 Bcf above the 5-year average as of January 3. It is important to note that the timing of this storage update does not account for the impact of Winter Storm Blair on natural gas storage volumes. Given the increased demand and reduced supply recorded for the first week of January and the anticipated effects from Winter Storm Cora, EIA may report larger withdrawals in subsequent storage reports.
For questions please contact Juan Alvarado | jalvarado@aga.org, Liz Pardue | lpardue@aga.org, or Lauren Scott | lscott@aga.org
To be added to the distribution list for this report, please notify Lucy Castaneda-Land | lcastaneda-land@aga.org
NOTICE
In issuing and making this publication available, AGA is not undertaking to render professional or other services for or on behalf of any person or entity. Nor is AGA undertaking to perform any duty owed by any person or entity to someone else. Anyone using this document should rely on his or her own independent judgment or, as appropriate, seek the advice of a competent professional in determining the exercise of reasonable care in any given circumstances. The statements in this publication are for general information and represent an unaudited compilation of statistical information that could contain coding or processing errors. AGA makes no warranties, express or implied, nor representations about the accuracy of the information in the publication or its appropriateness for any given purpose or situation. This publication shall not be construed as including advice, guidance, or recommendations to take, or not to take, any actions or decisions regarding any matter, including, without limitation, relating to investments or the purchase or sale of any securities, shares or other assets of any kind. Should you take any such action or decision; you do so at your own risk. Information on the topics covered by this publication may be available from other sources, which the user may wish to consult for additional views or information not covered by this publication.
Copyright © 2024 American Gas Association. All rights reserved.