Understanding Greenhouse Gas Emissions from Natural Gas – EPA 2024 Inventory (1990-2022)
Key Findings
Economy-Wide Emissions
- In 2022, net U.S. greenhouse gas (GHG) emissions were 5,489 million metric tons of carbon dioxide (CO2) equivalent (MMTCO2e). Gross U.S. greenhouse gas emissions from sources only were 6,343 MMTCO2e in 2022.
- Overall, net economy-wide emissions have increased by 1 percent since 2021, likely due to the continued rebound of economic activity after the height of the COVID-19 pandemic.
- Net greenhouse gas emissions were 16.5 percent below 2005 levels. The decline is primarily due to a shift to less CO2-intensive natural gas and an increase in the use of renewable energy generation in the electric power sector.
- Transportation activities accounted for the largest portion (over 28 percent) of total gross U.S. GHG emissions in 2022.
- Emissions from electric power generation accounted for the second-largest portion (nearly 25 percent), while emissions from industry accounted for the third-largest portion (nearly 23 percent).
- Carbon sequestration from the Land Use, Land-Use Change and Forestry (LULUCF) sector offset nearly 15 percent of total emissions in 2022.
Natural Gas Systems
- Total GHG emissions (methane, carbon dioxide and nitrous oxide) from natural gas systems in 2022 were 209.7 MMTCO2e, a decrease of 17 percent from 1990 and a decrease of 0.3 percent from 2021, both primarily due to decreases in methane (CH4) emissions. This represents 3.3 percent of total U.S. gross greenhouse gas emissions.
- Total methane (CH4) emissions from natural gas systems were 173.1 MMTCO2e in 2022, a nearly 21 percent decrease compared to 1990 emissions and a 1 percent decrease from 2021 emissions. Since 2011, GHG emissions from natural gas systems have decreased by 5 percent, primarily due to decreases in CH4 emissions.
- Natural gas distribution system greenhouse gas emissions, i.e. those associated with natural gas utility operations, were 15.3 MMTCO2e, representing 0.24% of total U.S. gross greenhouse gas emissions.
- Total natural gas system methane emissions as a share of U.S. natural gas gross withdrawals are 0.81%.
- The ratio of methane emissions from natural gas distribution systems to total U.S. natural gas deliveries is 0.12%.
- Natural gas distribution accounted for 9 percent of CH4 emissions from natural gas systems and less than 0.1 percent of CO2 emissions from natural gas systems.
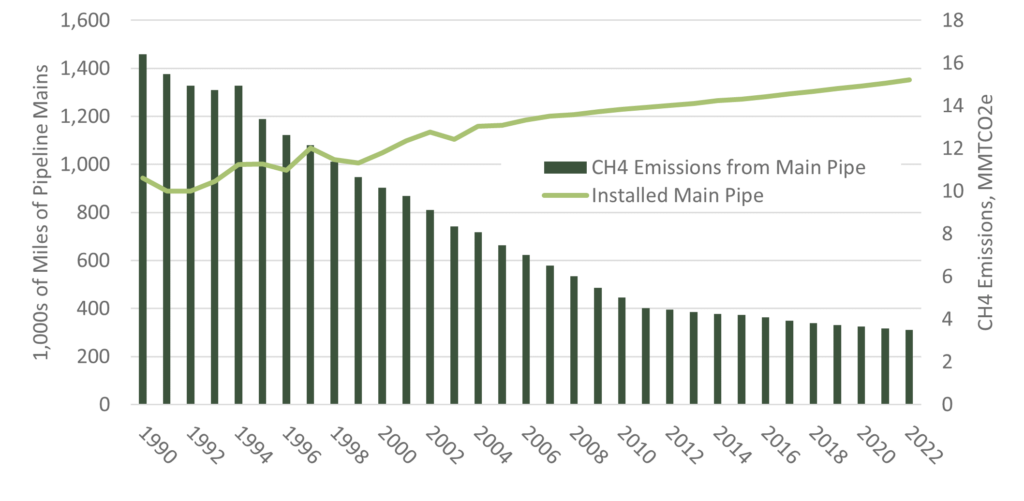
- There were 1,352,384 miles of distribution mains in 2022, an increase of 55 percent (480,227 miles) since 1990 (PHMSA 2022).
Figure 1:

- Figure 1 illustrates distribution system CH4 emissions and corresponding installed main pipe activity trends for the 1990 to 2022 time series.
- National total dry gas production in the United States increased by 104 percent from 1990 to 2022 — this includes a 5 percent increase from 2021 to 2022 and a 59-percent increase from 2011 to 2022.
- Of the overall GHG emissions from natural gas systems (209.7 MMTCO2e), 83 percent are CH4 emissions (173.1 MMTCO2e), 17 percent are CO2 emissions (36.5 MMTCO2e) and less than 0.1 percent are nitrous oxide (N2O) emissions (0.15 MMTCO2e).
- The change in natural gas system greenhouse gas emissions trend varies across segments and gases. Overall, the 1990 to 2022 decrease in CH4 emissions is due primarily to the reduction of emissions from the following segments: distribution (70 percent decrease), transmission and storage (38 percent decrease), processing (37 percent decrease) and exploration (97 percent decrease).
- Over the same period, the natural gas production segment saw increased CH4 emissions of 38 percent (with onshore production emissions increasing 16 percent, offshore production emissions decreasing 86 percent, gathering and boosting [G&B] emissions increasing 108 percent) and post-meter emissions increasing by 65 percent.
- CH4 emissions from the transmission and storage segment accounted for approximately 23 percent of CH4 emissions from natural gas systems. In comparison, CO2 emissions from transmission and storage accounted for 3 percent of the CO2 emissions from natural gas systems.
- CH4 emissions from transmission and storage decreased by 38 percent from 1990 to 2022due to reduced pneumatic device and compressor station emissions (including emissions from compressors and leaks). Transmission and storage CH4 emissions declined by 1 percent from2021 to 2022 due to reduced emissions from pipeline venting transmission compressors.
- CO2 emissions from transmission and storage were 6.6 times higher in 2022 than in 1990 due to increased emissions from liquefied natural gas (LNG) export terminals. Transmission and storage CO2 emissions increased by 36 percent from 2021 to 2022, also due to LNG export terminals and flaring (both transmission and storage).
- The quantity of LNG exported from the United States increased by a factor of 74 from 1990 to2022 and by 9 percent from 2021 to 2022.
- In 2022, LNG emissions were about 1 percent of CH4 and 86 percent of CO2 emissions from transmission and storage.
- N2O emissions from transmission and storage increased by 405 percent from 1990 to 2022and increased by 177 percent from 2021 to 2022.
Read the full report below: